Immigrants from Venezuela vs Alaskan Athabascan 7th Grade
COMPARE
Immigrants from Venezuela
Alaskan Athabascan
7th Grade
7th Grade Comparison
Immigrants from Venezuela
Alaskan Athabascans
95.9%
7TH GRADE
33.9/ 100
METRIC RATING
189th/ 347
METRIC RANK
97.6%
7TH GRADE
100.0/ 100
METRIC RATING
11th/ 347
METRIC RANK
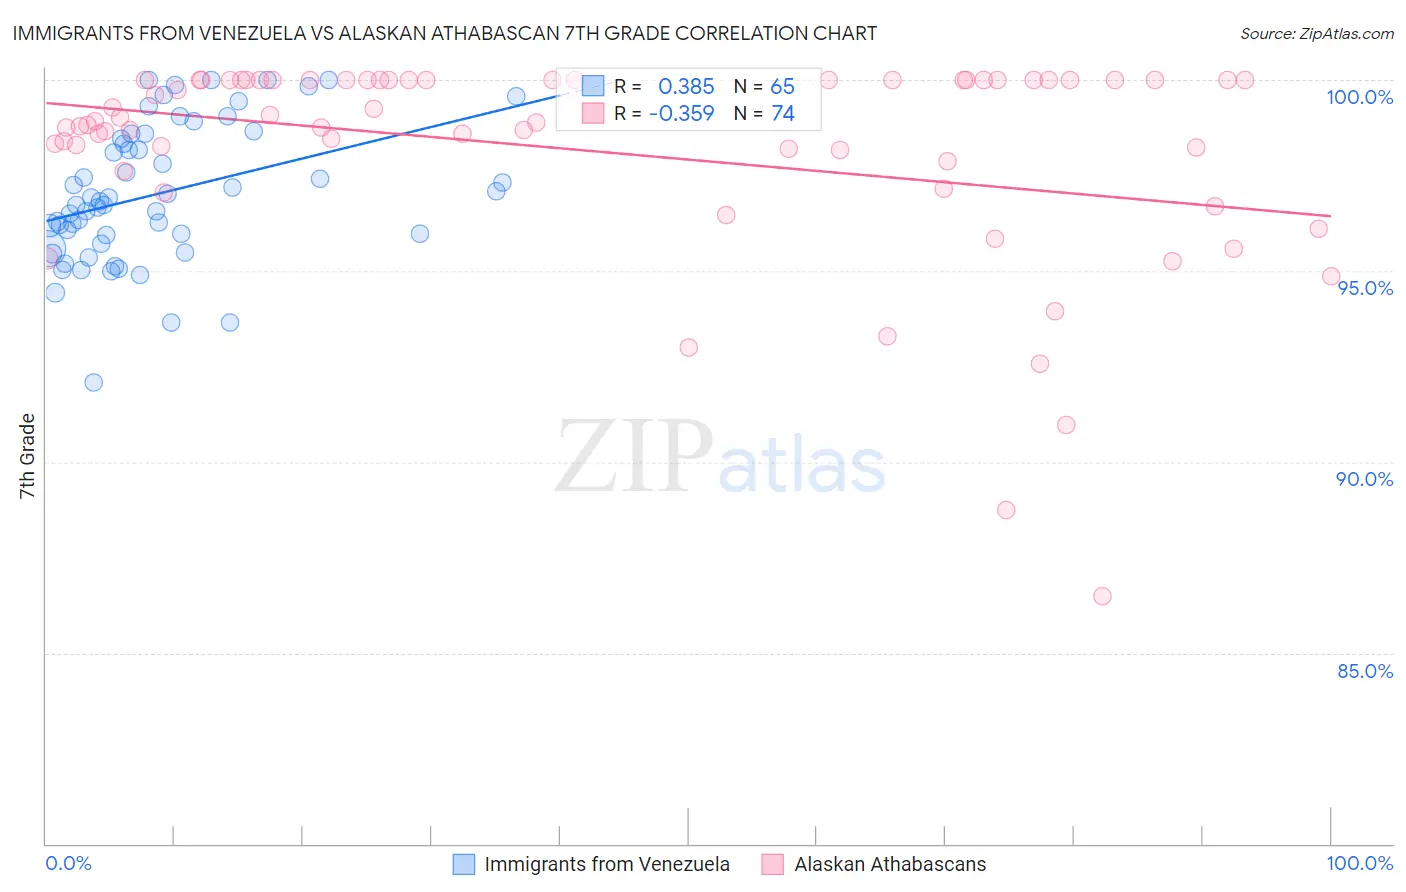
Immigrants from Venezuela vs Alaskan Athabascan 7th Grade Correlation Chart
The statistical analysis conducted on geographies consisting of 287,866,009 people shows a mild positive correlation between the proportion of Immigrants from Venezuela and percentage of population with at least 7th grade education in the United States with a correlation coefficient (R) of 0.385 and weighted average of 95.9%. Similarly, the statistical analysis conducted on geographies consisting of 45,820,365 people shows a mild negative correlation between the proportion of Alaskan Athabascans and percentage of population with at least 7th grade education in the United States with a correlation coefficient (R) of -0.359 and weighted average of 97.6%, a difference of 1.8%.
7th Grade Correlation Summary
| Measurement | Immigrants from Venezuela | Alaskan Athabascan |
| Minimum | 92.1% | 86.5% |
| Maximum | 100.0% | 100.0% |
| Range | 7.9% | 13.5% |
| Mean | 97.0% | 98.2% |
| Median | 96.8% | 98.9% |
| Interquartile 25% (IQ1) | 95.8% | 97.9% |
| Interquartile 75% (IQ3) | 98.5% | 100.0% |
| Interquartile Range (IQR) | 2.7% | 2.1% |
| Standard Deviation (Sample) | 1.8% | 2.7% |
| Standard Deviation (Population) | 1.8% | 2.7% |
Similar Demographics by 7th Grade
Demographics Similar to Immigrants from Venezuela by 7th Grade
In terms of 7th grade, the demographic groups most similar to Immigrants from Venezuela are Immigrants from Egypt (95.9%, a difference of 0.0%), Immigrants from Iraq (96.0%, a difference of 0.010%), Immigrants from Uganda (96.0%, a difference of 0.010%), Immigrants from Micronesia (95.9%, a difference of 0.010%), and Liberian (95.9%, a difference of 0.010%).
| Demographics | Rating | Rank | 7th Grade |
| Iraqis | 41.2 /100 | #182 | Average 96.0% |
| Immigrants | Spain | 38.8 /100 | #183 | Fair 96.0% |
| Sierra Leoneans | 37.5 /100 | #184 | Fair 96.0% |
| Brazilians | 37.3 /100 | #185 | Fair 96.0% |
| Immigrants | Iraq | 36.1 /100 | #186 | Fair 96.0% |
| Immigrants | Uganda | 36.0 /100 | #187 | Fair 96.0% |
| Immigrants | Egypt | 34.3 /100 | #188 | Fair 95.9% |
| Immigrants | Venezuela | 33.9 /100 | #189 | Fair 95.9% |
| Immigrants | Micronesia | 32.6 /100 | #190 | Fair 95.9% |
| Liberians | 32.5 /100 | #191 | Fair 95.9% |
| Panamanians | 32.3 /100 | #192 | Fair 95.9% |
| Immigrants | Bahamas | 30.8 /100 | #193 | Fair 95.9% |
| Immigrants | Nepal | 30.0 /100 | #194 | Fair 95.9% |
| Sudanese | 28.1 /100 | #195 | Fair 95.9% |
| Apache | 27.6 /100 | #196 | Fair 95.9% |
Demographics Similar to Alaskan Athabascans by 7th Grade
In terms of 7th grade, the demographic groups most similar to Alaskan Athabascans are Slovene (97.6%, a difference of 0.010%), Polish (97.6%, a difference of 0.010%), Swedish (97.6%, a difference of 0.040%), Pennsylvania German (97.6%, a difference of 0.050%), and English (97.6%, a difference of 0.060%).
| Demographics | Rating | Rank | 7th Grade |
| Ottawa | 100.0 /100 | #4 | Exceptional 98.1% |
| Dutch | 100.0 /100 | #5 | Exceptional 97.9% |
| Tsimshian | 100.0 /100 | #6 | Exceptional 97.8% |
| Norwegians | 100.0 /100 | #7 | Exceptional 97.8% |
| Slovaks | 100.0 /100 | #8 | Exceptional 97.8% |
| Germans | 100.0 /100 | #9 | Exceptional 97.7% |
| Slovenes | 100.0 /100 | #10 | Exceptional 97.6% |
| Alaskan Athabascans | 100.0 /100 | #11 | Exceptional 97.6% |
| Poles | 100.0 /100 | #12 | Exceptional 97.6% |
| Swedes | 100.0 /100 | #13 | Exceptional 97.6% |
| Pennsylvania Germans | 100.0 /100 | #14 | Exceptional 97.6% |
| English | 100.0 /100 | #15 | Exceptional 97.6% |
| Irish | 100.0 /100 | #16 | Exceptional 97.5% |
| Scottish | 100.0 /100 | #17 | Exceptional 97.5% |
| Tlingit-Haida | 100.0 /100 | #18 | Exceptional 97.5% |