Icelander vs Immigrants from South America College, 1 year or more
COMPARE
Icelander
Immigrants from South America
College, 1 year or more
College, 1 year or more Comparison
Icelanders
Immigrants from South America
62.1%
COLLEGE, 1 YEAR OR MORE
96.8/ 100
METRIC RATING
100th/ 347
METRIC RANK
58.4%
COLLEGE, 1 YEAR OR MORE
21.9/ 100
METRIC RATING
202nd/ 347
METRIC RANK
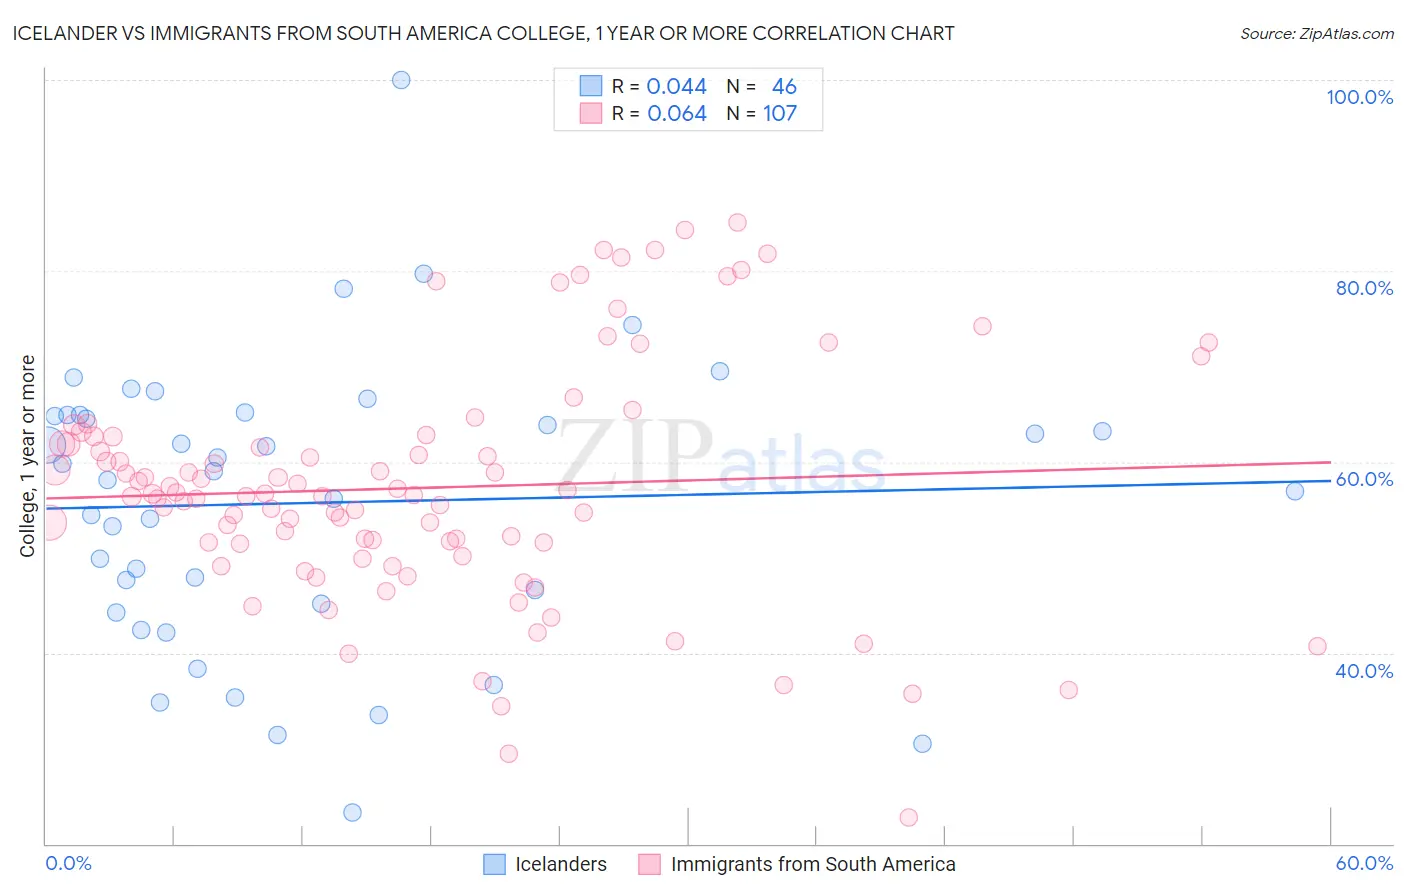
Icelander vs Immigrants from South America College, 1 year or more Correlation Chart
The statistical analysis conducted on geographies consisting of 159,668,975 people shows no correlation between the proportion of Icelanders and percentage of population with at least college, 1 year or more education in the United States with a correlation coefficient (R) of 0.044 and weighted average of 62.1%. Similarly, the statistical analysis conducted on geographies consisting of 486,428,336 people shows a slight positive correlation between the proportion of Immigrants from South America and percentage of population with at least college, 1 year or more education in the United States with a correlation coefficient (R) of 0.064 and weighted average of 58.4%, a difference of 6.3%.
College, 1 year or more Correlation Summary
| Measurement | Icelander | Immigrants from South America |
| Minimum | 23.3% | 22.7% |
| Maximum | 100.0% | 85.1% |
| Range | 76.7% | 62.3% |
| Mean | 55.7% | 57.3% |
| Median | 58.5% | 56.5% |
| Interquartile 25% (IQ1) | 45.2% | 51.4% |
| Interquartile 75% (IQ3) | 64.9% | 62.6% |
| Interquartile Range (IQR) | 19.7% | 11.2% |
| Standard Deviation (Sample) | 15.0% | 12.3% |
| Standard Deviation (Population) | 14.8% | 12.3% |
Similar Demographics by College, 1 year or more
Demographics Similar to Icelanders by College, 1 year or more
In terms of college, 1 year or more, the demographic groups most similar to Icelanders are Swedish (62.1%, a difference of 0.0%), Luxembourger (62.1%, a difference of 0.020%), Afghan (62.0%, a difference of 0.13%), Chilean (62.0%, a difference of 0.15%), and Croatian (62.2%, a difference of 0.16%).
| Demographics | Rating | Rank | College, 1 year or more |
| Romanians | 97.7 /100 | #93 | Exceptional 62.4% |
| Immigrants | Croatia | 97.6 /100 | #94 | Exceptional 62.3% |
| British | 97.4 /100 | #95 | Exceptional 62.3% |
| Chinese | 97.2 /100 | #96 | Exceptional 62.2% |
| Jordanians | 97.2 /100 | #97 | Exceptional 62.2% |
| Carpatho Rusyns | 97.2 /100 | #98 | Exceptional 62.2% |
| Croatians | 97.1 /100 | #99 | Exceptional 62.2% |
| Icelanders | 96.8 /100 | #100 | Exceptional 62.1% |
| Swedes | 96.8 /100 | #101 | Exceptional 62.1% |
| Luxembourgers | 96.7 /100 | #102 | Exceptional 62.1% |
| Afghans | 96.4 /100 | #103 | Exceptional 62.0% |
| Chileans | 96.4 /100 | #104 | Exceptional 62.0% |
| Immigrants | Nepal | 96.3 /100 | #105 | Exceptional 62.0% |
| Palestinians | 96.3 /100 | #106 | Exceptional 62.0% |
| Immigrants | Ukraine | 95.8 /100 | #107 | Exceptional 61.9% |
Demographics Similar to Immigrants from South America by College, 1 year or more
In terms of college, 1 year or more, the demographic groups most similar to Immigrants from South America are Nigerian (58.5%, a difference of 0.080%), Ghanaian (58.4%, a difference of 0.090%), Spanish (58.5%, a difference of 0.17%), Slovak (58.5%, a difference of 0.20%), and Panamanian (58.3%, a difference of 0.23%).
| Demographics | Rating | Rank | College, 1 year or more |
| Dutch | 26.2 /100 | #195 | Fair 58.6% |
| Guamanians/Chamorros | 26.2 /100 | #196 | Fair 58.6% |
| Immigrants | Thailand | 26.0 /100 | #197 | Fair 58.6% |
| Immigrants | South Eastern Asia | 25.1 /100 | #198 | Fair 58.5% |
| Slovaks | 24.6 /100 | #199 | Fair 58.5% |
| Spanish | 24.2 /100 | #200 | Fair 58.5% |
| Nigerians | 23.0 /100 | #201 | Fair 58.5% |
| Immigrants | South America | 21.9 /100 | #202 | Fair 58.4% |
| Ghanaians | 20.9 /100 | #203 | Fair 58.4% |
| Panamanians | 19.2 /100 | #204 | Poor 58.3% |
| Immigrants | Zaire | 18.7 /100 | #205 | Poor 58.3% |
| Immigrants | Vietnam | 18.2 /100 | #206 | Poor 58.2% |
| Senegalese | 16.9 /100 | #207 | Poor 58.2% |
| Immigrants | Uruguay | 15.2 /100 | #208 | Poor 58.1% |
| Immigrants | Middle Africa | 14.0 /100 | #209 | Poor 58.0% |