Immigrants from Uzbekistan vs Icelander Disability Age 18 to 34
COMPARE
Immigrants from Uzbekistan
Icelander
Disability Age 18 to 34
Disability Age 18 to 34 Comparison
Immigrants from Uzbekistan
Icelanders
5.5%
DISABILITY AGE 18 TO 34
100.0/ 100
METRIC RATING
10th/ 347
METRIC RANK
7.1%
DISABILITY AGE 18 TO 34
1.0/ 100
METRIC RATING
243rd/ 347
METRIC RANK
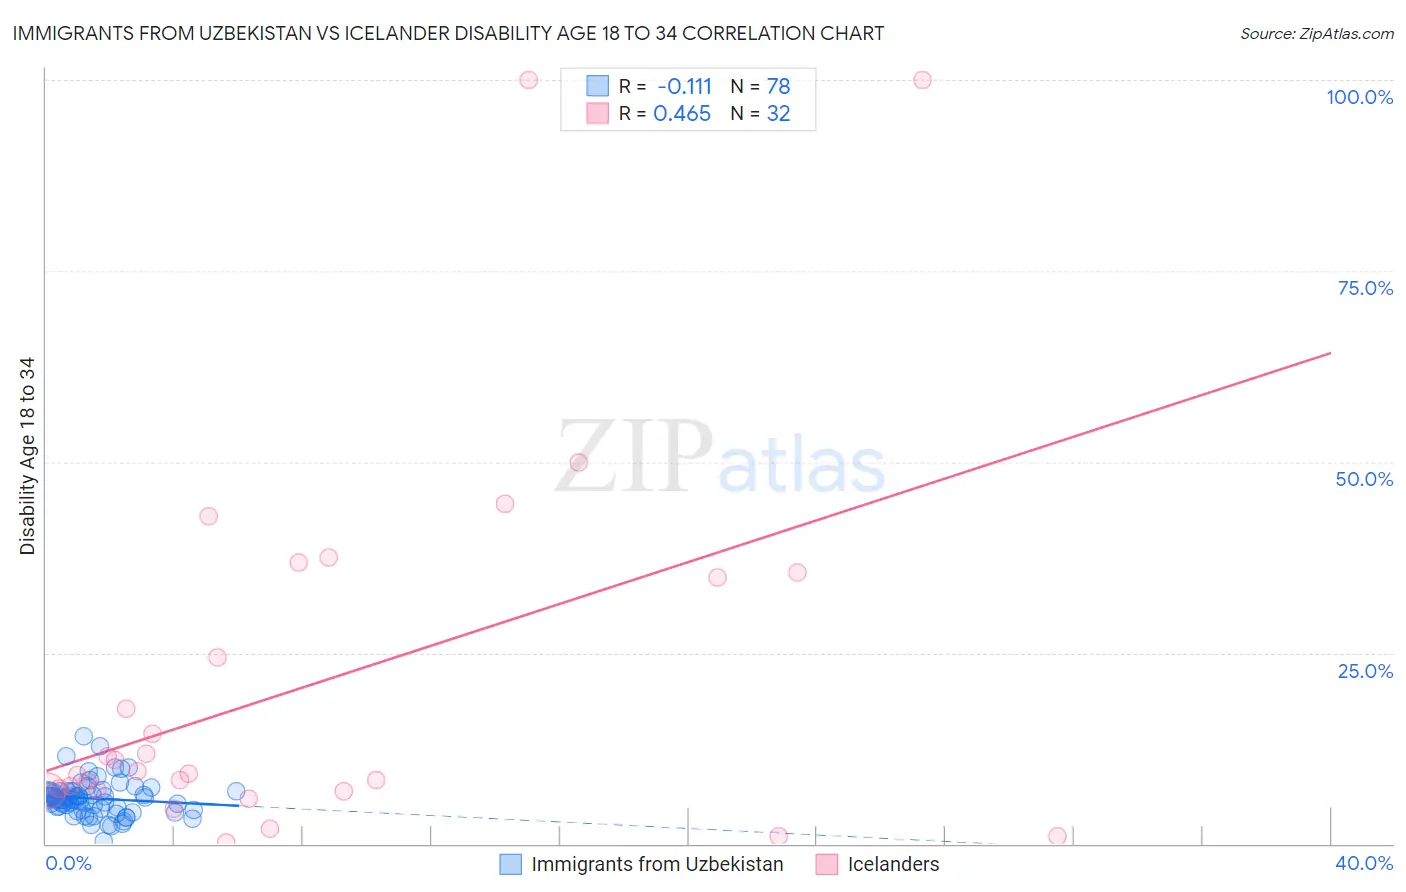
Immigrants from Uzbekistan vs Icelander Disability Age 18 to 34 Correlation Chart
The statistical analysis conducted on geographies consisting of 118,643,782 people shows a poor negative correlation between the proportion of Immigrants from Uzbekistan and percentage of population with a disability between the ages 18 and 35 in the United States with a correlation coefficient (R) of -0.111 and weighted average of 5.5%. Similarly, the statistical analysis conducted on geographies consisting of 159,438,295 people shows a moderate positive correlation between the proportion of Icelanders and percentage of population with a disability between the ages 18 and 35 in the United States with a correlation coefficient (R) of 0.465 and weighted average of 7.1%, a difference of 29.1%.
Disability Age 18 to 34 Correlation Summary
| Measurement | Immigrants from Uzbekistan | Icelander |
| Minimum | 0.35% | 0.23% |
| Maximum | 14.0% | 100.0% |
| Range | 13.7% | 99.8% |
| Mean | 5.9% | 21.1% |
| Median | 5.9% | 9.3% |
| Interquartile 25% (IQ1) | 4.6% | 7.0% |
| Interquartile 75% (IQ3) | 6.8% | 35.2% |
| Interquartile Range (IQR) | 2.2% | 28.2% |
| Standard Deviation (Sample) | 2.3% | 25.1% |
| Standard Deviation (Population) | 2.3% | 24.7% |
Similar Demographics by Disability Age 18 to 34
Demographics Similar to Immigrants from Uzbekistan by Disability Age 18 to 34
In terms of disability age 18 to 34, the demographic groups most similar to Immigrants from Uzbekistan are Vietnamese (5.5%, a difference of 0.070%), Immigrants from St. Vincent and the Grenadines (5.5%, a difference of 0.13%), Guyanese (5.5%, a difference of 0.15%), Immigrants from Iran (5.5%, a difference of 0.45%), and Indian (Asian) (5.5%, a difference of 0.60%).
| Demographics | Rating | Rank | Disability Age 18 to 34 |
| Immigrants | Grenada | 100.0 /100 | #3 | Exceptional 5.3% |
| Immigrants | Cuba | 100.0 /100 | #4 | Exceptional 5.4% |
| Immigrants | Taiwan | 100.0 /100 | #5 | Exceptional 5.4% |
| Filipinos | 100.0 /100 | #6 | Exceptional 5.4% |
| Immigrants | China | 100.0 /100 | #7 | Exceptional 5.4% |
| Immigrants | Guyana | 100.0 /100 | #8 | Exceptional 5.5% |
| Guyanese | 100.0 /100 | #9 | Exceptional 5.5% |
| Immigrants | Uzbekistan | 100.0 /100 | #10 | Exceptional 5.5% |
| Vietnamese | 100.0 /100 | #11 | Exceptional 5.5% |
| Immigrants | St. Vincent and the Grenadines | 100.0 /100 | #12 | Exceptional 5.5% |
| Immigrants | Iran | 100.0 /100 | #13 | Exceptional 5.5% |
| Indians (Asian) | 100.0 /100 | #14 | Exceptional 5.5% |
| Immigrants | India | 100.0 /100 | #15 | Exceptional 5.6% |
| Immigrants | Israel | 100.0 /100 | #16 | Exceptional 5.6% |
| Immigrants | Eastern Asia | 100.0 /100 | #17 | Exceptional 5.6% |
Demographics Similar to Icelanders by Disability Age 18 to 34
In terms of disability age 18 to 34, the demographic groups most similar to Icelanders are Immigrants from Congo (7.1%, a difference of 0.070%), Arapaho (7.1%, a difference of 0.11%), Nepalese (7.1%, a difference of 0.11%), Immigrants from Zaire (7.1%, a difference of 0.20%), and Italian (7.1%, a difference of 0.23%).
| Demographics | Rating | Rank | Disability Age 18 to 34 |
| Liberians | 1.5 /100 | #236 | Tragic 7.1% |
| Austrians | 1.3 /100 | #237 | Tragic 7.1% |
| Marshallese | 1.3 /100 | #238 | Tragic 7.1% |
| Italians | 1.2 /100 | #239 | Tragic 7.1% |
| Arapaho | 1.1 /100 | #240 | Tragic 7.1% |
| Nepalese | 1.1 /100 | #241 | Tragic 7.1% |
| Immigrants | Congo | 1.1 /100 | #242 | Tragic 7.1% |
| Icelanders | 1.0 /100 | #243 | Tragic 7.1% |
| Immigrants | Zaire | 0.9 /100 | #244 | Tragic 7.1% |
| Hungarians | 0.9 /100 | #245 | Tragic 7.1% |
| Immigrants | Liberia | 0.8 /100 | #246 | Tragic 7.1% |
| Yugoslavians | 0.8 /100 | #247 | Tragic 7.2% |
| Guamanians/Chamorros | 0.8 /100 | #248 | Tragic 7.2% |
| Malaysians | 0.7 /100 | #249 | Tragic 7.2% |
| Fijians | 0.6 /100 | #250 | Tragic 7.2% |