Immigrants from Uruguay vs Russian Bachelor's Degree
COMPARE
Immigrants from Uruguay
Russian
Bachelor's Degree
Bachelor's Degree Comparison
Immigrants from Uruguay
Russians
37.8%
BACHELOR'S DEGREE
48.3/ 100
METRIC RATING
175th/ 347
METRIC RANK
45.3%
BACHELOR'S DEGREE
100.0/ 100
METRIC RATING
37th/ 347
METRIC RANK
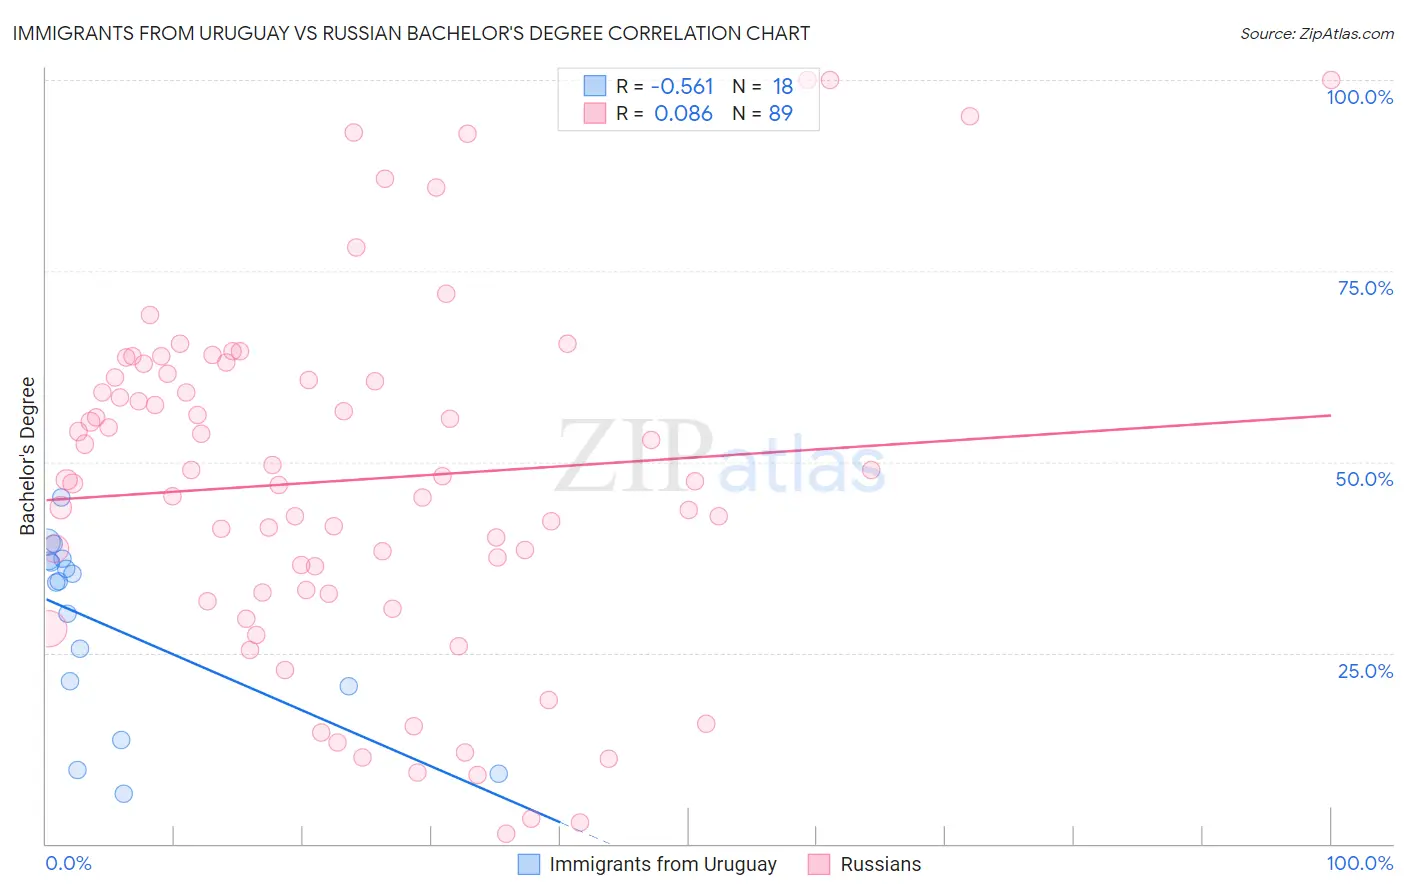
Immigrants from Uruguay vs Russian Bachelor's Degree Correlation Chart
The statistical analysis conducted on geographies consisting of 133,259,667 people shows a substantial negative correlation between the proportion of Immigrants from Uruguay and percentage of population with at least bachelor's degree education in the United States with a correlation coefficient (R) of -0.561 and weighted average of 37.8%. Similarly, the statistical analysis conducted on geographies consisting of 512,185,650 people shows a slight positive correlation between the proportion of Russians and percentage of population with at least bachelor's degree education in the United States with a correlation coefficient (R) of 0.086 and weighted average of 45.3%, a difference of 20.1%.
Bachelor's Degree Correlation Summary
| Measurement | Immigrants from Uruguay | Russian |
| Minimum | 6.5% | 1.3% |
| Maximum | 45.3% | 100.0% |
| Range | 38.8% | 98.7% |
| Mean | 28.4% | 47.6% |
| Median | 34.4% | 47.6% |
| Interquartile 25% (IQ1) | 20.6% | 32.8% |
| Interquartile 75% (IQ3) | 37.0% | 61.3% |
| Interquartile Range (IQR) | 16.4% | 28.5% |
| Standard Deviation (Sample) | 12.1% | 23.1% |
| Standard Deviation (Population) | 11.7% | 23.0% |
Similar Demographics by Bachelor's Degree
Demographics Similar to Immigrants from Uruguay by Bachelor's Degree
In terms of bachelor's degree, the demographic groups most similar to Immigrants from Uruguay are Costa Rican (37.7%, a difference of 0.080%), Basque (37.7%, a difference of 0.090%), Immigrants from Cameroon (37.7%, a difference of 0.15%), Immigrants from Bangladesh (37.8%, a difference of 0.16%), and Immigrants from Colombia (37.7%, a difference of 0.29%).
| Demographics | Rating | Rank | Bachelor's Degree |
| Danes | 56.2 /100 | #168 | Average 38.1% |
| Ghanaians | 55.3 /100 | #169 | Average 38.0% |
| Czechs | 54.4 /100 | #170 | Average 38.0% |
| Bermudans | 54.2 /100 | #171 | Average 38.0% |
| Immigrants | Somalia | 52.8 /100 | #172 | Average 37.9% |
| Immigrants | Iraq | 52.5 /100 | #173 | Average 37.9% |
| Immigrants | Bangladesh | 50.0 /100 | #174 | Average 37.8% |
| Immigrants | Uruguay | 48.3 /100 | #175 | Average 37.8% |
| Costa Ricans | 47.6 /100 | #176 | Average 37.7% |
| Basques | 47.4 /100 | #177 | Average 37.7% |
| Immigrants | Cameroon | 46.8 /100 | #178 | Average 37.7% |
| Immigrants | Colombia | 45.4 /100 | #179 | Average 37.7% |
| Irish | 44.3 /100 | #180 | Average 37.6% |
| Immigrants | Senegal | 43.8 /100 | #181 | Average 37.6% |
| Immigrants | Bosnia and Herzegovina | 43.4 /100 | #182 | Average 37.6% |
Demographics Similar to Russians by Bachelor's Degree
In terms of bachelor's degree, the demographic groups most similar to Russians are Bulgarian (45.3%, a difference of 0.090%), Mongolian (45.4%, a difference of 0.15%), Immigrants from Russia (45.4%, a difference of 0.17%), Immigrants from Denmark (45.4%, a difference of 0.19%), and Immigrants from Latvia (45.1%, a difference of 0.42%).
| Demographics | Rating | Rank | Bachelor's Degree |
| Immigrants | Sri Lanka | 100.0 /100 | #30 | Exceptional 46.1% |
| Latvians | 100.0 /100 | #31 | Exceptional 46.1% |
| Immigrants | Turkey | 100.0 /100 | #32 | Exceptional 46.0% |
| Immigrants | Northern Europe | 100.0 /100 | #33 | Exceptional 45.6% |
| Immigrants | Denmark | 100.0 /100 | #34 | Exceptional 45.4% |
| Immigrants | Russia | 100.0 /100 | #35 | Exceptional 45.4% |
| Mongolians | 100.0 /100 | #36 | Exceptional 45.4% |
| Russians | 100.0 /100 | #37 | Exceptional 45.3% |
| Bulgarians | 100.0 /100 | #38 | Exceptional 45.3% |
| Immigrants | Latvia | 100.0 /100 | #39 | Exceptional 45.1% |
| Immigrants | Belarus | 100.0 /100 | #40 | Exceptional 45.0% |
| Immigrants | Malaysia | 100.0 /100 | #41 | Exceptional 45.0% |
| Immigrants | Saudi Arabia | 100.0 /100 | #42 | Exceptional 44.8% |
| Immigrants | South Africa | 99.9 /100 | #43 | Exceptional 44.8% |
| Immigrants | Lithuania | 99.9 /100 | #44 | Exceptional 44.6% |