Immigrants from England vs Russian Bachelor's Degree
COMPARE
Immigrants from England
Russian
Bachelor's Degree
Bachelor's Degree Comparison
Immigrants from England
Russians
41.4%
BACHELOR'S DEGREE
98.1/ 100
METRIC RATING
99th/ 347
METRIC RANK
45.3%
BACHELOR'S DEGREE
100.0/ 100
METRIC RATING
37th/ 347
METRIC RANK
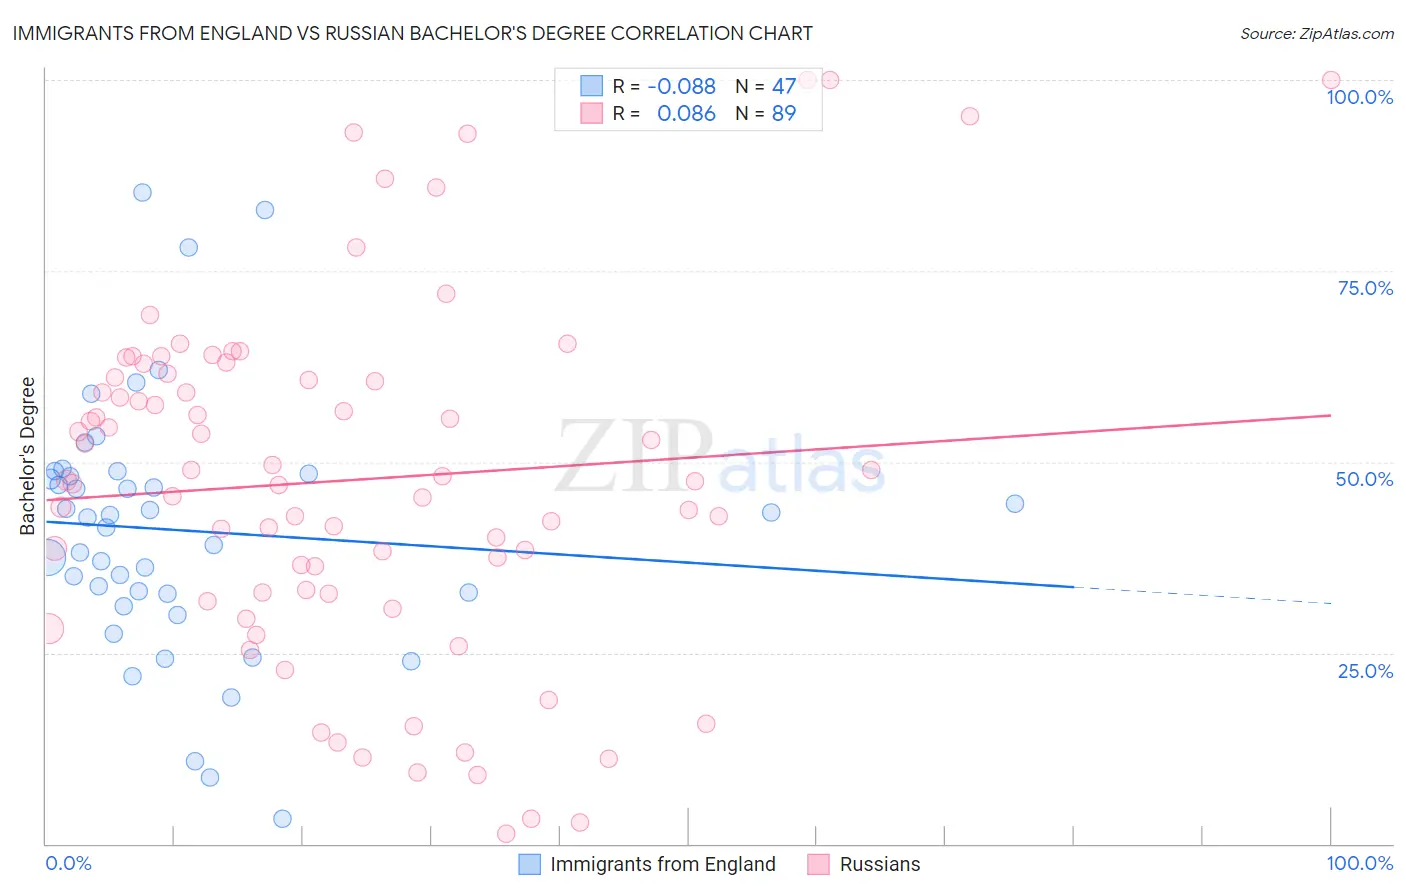
Immigrants from England vs Russian Bachelor's Degree Correlation Chart
The statistical analysis conducted on geographies consisting of 391,879,677 people shows a slight negative correlation between the proportion of Immigrants from England and percentage of population with at least bachelor's degree education in the United States with a correlation coefficient (R) of -0.088 and weighted average of 41.4%. Similarly, the statistical analysis conducted on geographies consisting of 512,185,650 people shows a slight positive correlation between the proportion of Russians and percentage of population with at least bachelor's degree education in the United States with a correlation coefficient (R) of 0.086 and weighted average of 45.3%, a difference of 9.4%.
Bachelor's Degree Correlation Summary
| Measurement | Immigrants from England | Russian |
| Minimum | 3.3% | 1.3% |
| Maximum | 85.3% | 100.0% |
| Range | 82.0% | 98.7% |
| Mean | 41.0% | 47.6% |
| Median | 42.7% | 47.6% |
| Interquartile 25% (IQ1) | 32.7% | 32.8% |
| Interquartile 75% (IQ3) | 48.4% | 61.3% |
| Interquartile Range (IQR) | 15.7% | 28.5% |
| Standard Deviation (Sample) | 16.7% | 23.1% |
| Standard Deviation (Population) | 16.6% | 23.0% |
Similar Demographics by Bachelor's Degree
Demographics Similar to Immigrants from England by Bachelor's Degree
In terms of bachelor's degree, the demographic groups most similar to Immigrants from England are Macedonian (41.4%, a difference of 0.030%), Immigrants from Morocco (41.4%, a difference of 0.060%), Immigrants from Ukraine (41.5%, a difference of 0.24%), Immigrants from Italy (41.3%, a difference of 0.32%), and Romanian (41.6%, a difference of 0.35%).
| Demographics | Rating | Rank | Bachelor's Degree |
| Maltese | 98.8 /100 | #92 | Exceptional 41.9% |
| Immigrants | Canada | 98.6 /100 | #93 | Exceptional 41.7% |
| Immigrants | Nepal | 98.6 /100 | #94 | Exceptional 41.7% |
| Immigrants | North America | 98.5 /100 | #95 | Exceptional 41.7% |
| Immigrants | Moldova | 98.4 /100 | #96 | Exceptional 41.6% |
| Romanians | 98.4 /100 | #97 | Exceptional 41.6% |
| Immigrants | Ukraine | 98.3 /100 | #98 | Exceptional 41.5% |
| Immigrants | England | 98.1 /100 | #99 | Exceptional 41.4% |
| Macedonians | 98.1 /100 | #100 | Exceptional 41.4% |
| Immigrants | Morocco | 98.0 /100 | #101 | Exceptional 41.4% |
| Immigrants | Italy | 97.8 /100 | #102 | Exceptional 41.3% |
| Chileans | 97.5 /100 | #103 | Exceptional 41.2% |
| Jordanians | 97.4 /100 | #104 | Exceptional 41.2% |
| Syrians | 97.4 /100 | #105 | Exceptional 41.1% |
| Alsatians | 97.0 /100 | #106 | Exceptional 41.0% |
Demographics Similar to Russians by Bachelor's Degree
In terms of bachelor's degree, the demographic groups most similar to Russians are Bulgarian (45.3%, a difference of 0.090%), Mongolian (45.4%, a difference of 0.15%), Immigrants from Russia (45.4%, a difference of 0.17%), Immigrants from Denmark (45.4%, a difference of 0.19%), and Immigrants from Latvia (45.1%, a difference of 0.42%).
| Demographics | Rating | Rank | Bachelor's Degree |
| Immigrants | Sri Lanka | 100.0 /100 | #30 | Exceptional 46.1% |
| Latvians | 100.0 /100 | #31 | Exceptional 46.1% |
| Immigrants | Turkey | 100.0 /100 | #32 | Exceptional 46.0% |
| Immigrants | Northern Europe | 100.0 /100 | #33 | Exceptional 45.6% |
| Immigrants | Denmark | 100.0 /100 | #34 | Exceptional 45.4% |
| Immigrants | Russia | 100.0 /100 | #35 | Exceptional 45.4% |
| Mongolians | 100.0 /100 | #36 | Exceptional 45.4% |
| Russians | 100.0 /100 | #37 | Exceptional 45.3% |
| Bulgarians | 100.0 /100 | #38 | Exceptional 45.3% |
| Immigrants | Latvia | 100.0 /100 | #39 | Exceptional 45.1% |
| Immigrants | Belarus | 100.0 /100 | #40 | Exceptional 45.0% |
| Immigrants | Malaysia | 100.0 /100 | #41 | Exceptional 45.0% |
| Immigrants | Saudi Arabia | 100.0 /100 | #42 | Exceptional 44.8% |
| Immigrants | South Africa | 99.9 /100 | #43 | Exceptional 44.8% |
| Immigrants | Lithuania | 99.9 /100 | #44 | Exceptional 44.6% |