Immigrants from Uruguay vs Russian In Labor Force | Age 20-24
COMPARE
Immigrants from Uruguay
Russian
In Labor Force | Age 20-24
In Labor Force | Age 20-24 Comparison
Immigrants from Uruguay
Russians
74.6%
IN LABOR FORCE | AGE 20-24
15.8/ 100
METRIC RATING
208th/ 347
METRIC RANK
74.8%
IN LABOR FORCE | AGE 20-24
32.2/ 100
METRIC RATING
190th/ 347
METRIC RANK
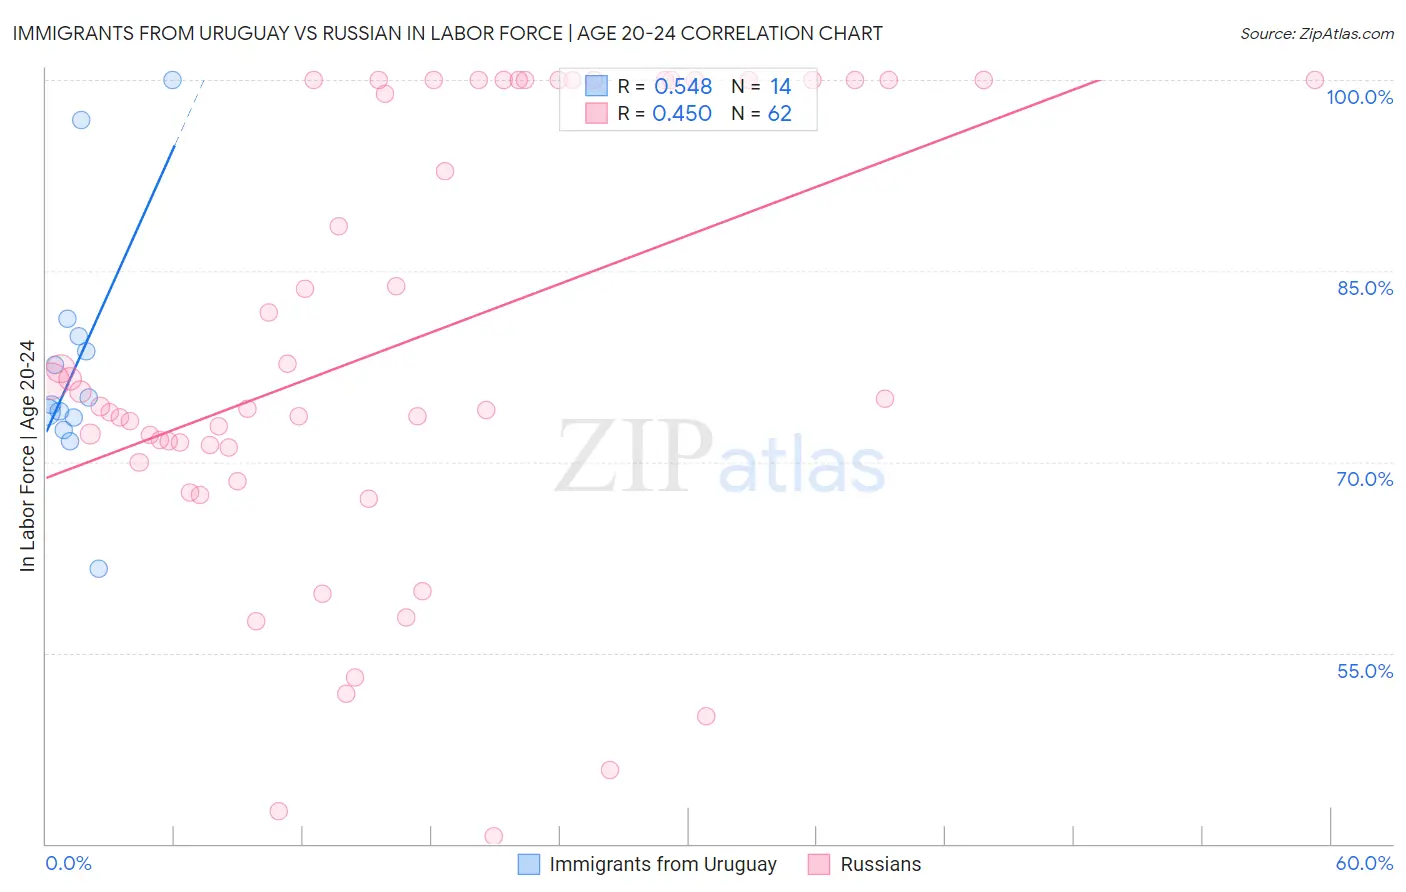
Immigrants from Uruguay vs Russian In Labor Force | Age 20-24 Correlation Chart
The statistical analysis conducted on geographies consisting of 133,248,800 people shows a substantial positive correlation between the proportion of Immigrants from Uruguay and labor force participation rate among population between the ages 20 and 24 in the United States with a correlation coefficient (R) of 0.548 and weighted average of 74.6%. Similarly, the statistical analysis conducted on geographies consisting of 511,601,024 people shows a moderate positive correlation between the proportion of Russians and labor force participation rate among population between the ages 20 and 24 in the United States with a correlation coefficient (R) of 0.450 and weighted average of 74.8%, a difference of 0.34%.
In Labor Force | Age 20-24 Correlation Summary
| Measurement | Immigrants from Uruguay | Russian |
| Minimum | 61.6% | 40.6% |
| Maximum | 100.0% | 100.0% |
| Range | 38.4% | 59.4% |
| Mean | 77.9% | 79.2% |
| Median | 74.8% | 74.7% |
| Interquartile 25% (IQ1) | 73.5% | 71.1% |
| Interquartile 75% (IQ3) | 79.9% | 100.0% |
| Interquartile Range (IQR) | 6.4% | 28.9% |
| Standard Deviation (Sample) | 9.9% | 17.3% |
| Standard Deviation (Population) | 9.5% | 17.1% |
Demographics Similar to Immigrants from Uruguay and Russians by In Labor Force | Age 20-24
In terms of in labor force | age 20-24, the demographic groups most similar to Immigrants from Uruguay are Arab (74.6%, a difference of 0.0%), Albanian (74.6%, a difference of 0.010%), Sioux (74.6%, a difference of 0.040%), Immigrants from Italy (74.6%, a difference of 0.050%), and Inupiat (74.6%, a difference of 0.050%). Similarly, the demographic groups most similar to Russians are Immigrants from Northern Europe (74.8%, a difference of 0.010%), Senegalese (74.8%, a difference of 0.070%), Immigrants from Europe (74.8%, a difference of 0.080%), Alsatian (74.8%, a difference of 0.090%), and Immigrants from Denmark (74.8%, a difference of 0.12%).
| Demographics | Rating | Rank | In Labor Force | Age 20-24 |
| Immigrants | Northern Europe | 32.6 /100 | #189 | Fair 74.8% |
| Russians | 32.2 /100 | #190 | Fair 74.8% |
| Senegalese | 28.1 /100 | #191 | Fair 74.8% |
| Immigrants | Europe | 27.5 /100 | #192 | Fair 74.8% |
| Alsatians | 27.1 /100 | #193 | Fair 74.8% |
| Immigrants | Denmark | 25.8 /100 | #194 | Fair 74.8% |
| Eastern Europeans | 25.4 /100 | #195 | Fair 74.8% |
| Immigrants | Vietnam | 25.1 /100 | #196 | Fair 74.7% |
| Panamanians | 25.0 /100 | #197 | Fair 74.7% |
| Immigrants | Nigeria | 24.2 /100 | #198 | Fair 74.7% |
| Taiwanese | 23.2 /100 | #199 | Fair 74.7% |
| Nigerians | 21.9 /100 | #200 | Fair 74.7% |
| Choctaw | 21.4 /100 | #201 | Fair 74.7% |
| Moroccans | 20.4 /100 | #202 | Fair 74.7% |
| Immigrants | Northern Africa | 17.9 /100 | #203 | Poor 74.6% |
| Immigrants | Italy | 17.6 /100 | #204 | Poor 74.6% |
| Inupiat | 17.6 /100 | #205 | Poor 74.6% |
| Sioux | 17.5 /100 | #206 | Poor 74.6% |
| Albanians | 16.2 /100 | #207 | Poor 74.6% |
| Immigrants | Uruguay | 15.8 /100 | #208 | Poor 74.6% |
| Arabs | 15.8 /100 | #209 | Poor 74.6% |