Immigrants from Trinidad and Tobago vs Russian Bachelor's Degree
COMPARE
Immigrants from Trinidad and Tobago
Russian
Bachelor's Degree
Bachelor's Degree Comparison
Immigrants from Trinidad and Tobago
Russians
35.3%
BACHELOR'S DEGREE
6.0/ 100
METRIC RATING
228th/ 347
METRIC RANK
45.3%
BACHELOR'S DEGREE
100.0/ 100
METRIC RATING
37th/ 347
METRIC RANK
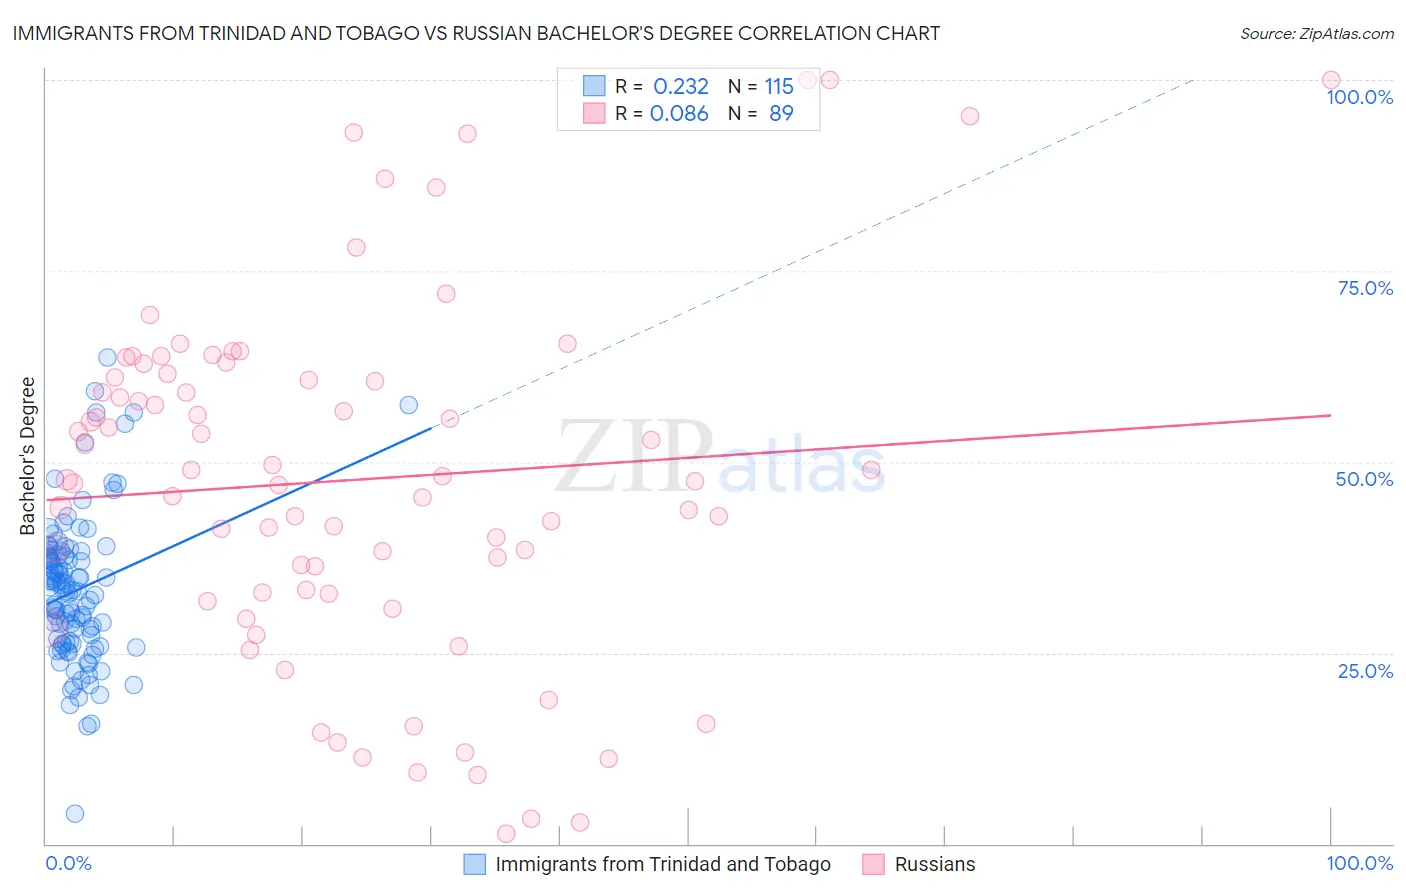
Immigrants from Trinidad and Tobago vs Russian Bachelor's Degree Correlation Chart
The statistical analysis conducted on geographies consisting of 223,534,325 people shows a weak positive correlation between the proportion of Immigrants from Trinidad and Tobago and percentage of population with at least bachelor's degree education in the United States with a correlation coefficient (R) of 0.232 and weighted average of 35.3%. Similarly, the statistical analysis conducted on geographies consisting of 512,185,650 people shows a slight positive correlation between the proportion of Russians and percentage of population with at least bachelor's degree education in the United States with a correlation coefficient (R) of 0.086 and weighted average of 45.3%, a difference of 28.4%.
Bachelor's Degree Correlation Summary
| Measurement | Immigrants from Trinidad and Tobago | Russian |
| Minimum | 4.0% | 1.3% |
| Maximum | 63.7% | 100.0% |
| Range | 59.7% | 98.7% |
| Mean | 33.2% | 47.6% |
| Median | 33.2% | 47.6% |
| Interquartile 25% (IQ1) | 26.4% | 32.8% |
| Interquartile 75% (IQ3) | 37.8% | 61.3% |
| Interquartile Range (IQR) | 11.4% | 28.5% |
| Standard Deviation (Sample) | 9.6% | 23.1% |
| Standard Deviation (Population) | 9.6% | 23.0% |
Similar Demographics by Bachelor's Degree
Demographics Similar to Immigrants from Trinidad and Tobago by Bachelor's Degree
In terms of bachelor's degree, the demographic groups most similar to Immigrants from Trinidad and Tobago are White/Caucasian (35.3%, a difference of 0.080%), Ecuadorian (35.4%, a difference of 0.23%), Portuguese (35.5%, a difference of 0.49%), Immigrants from Burma/Myanmar (35.5%, a difference of 0.53%), and Immigrants from Barbados (35.5%, a difference of 0.60%).
| Demographics | Rating | Rank | Bachelor's Degree |
| Dutch | 9.2 /100 | #221 | Tragic 35.7% |
| Trinidadians and Tobagonians | 8.8 /100 | #222 | Tragic 35.7% |
| French Canadians | 8.3 /100 | #223 | Tragic 35.6% |
| Immigrants | Barbados | 7.5 /100 | #224 | Tragic 35.5% |
| Immigrants | Burma/Myanmar | 7.3 /100 | #225 | Tragic 35.5% |
| Portuguese | 7.2 /100 | #226 | Tragic 35.5% |
| Ecuadorians | 6.6 /100 | #227 | Tragic 35.4% |
| Immigrants | Trinidad and Tobago | 6.0 /100 | #228 | Tragic 35.3% |
| Whites/Caucasians | 5.9 /100 | #229 | Tragic 35.3% |
| Immigrants | Grenada | 4.3 /100 | #230 | Tragic 35.0% |
| Immigrants | St. Vincent and the Grenadines | 4.3 /100 | #231 | Tragic 35.0% |
| Hmong | 3.4 /100 | #232 | Tragic 34.8% |
| Immigrants | Ecuador | 3.3 /100 | #233 | Tragic 34.7% |
| Guamanians/Chamorros | 3.0 /100 | #234 | Tragic 34.6% |
| Immigrants | West Indies | 2.9 /100 | #235 | Tragic 34.6% |
Demographics Similar to Russians by Bachelor's Degree
In terms of bachelor's degree, the demographic groups most similar to Russians are Bulgarian (45.3%, a difference of 0.090%), Mongolian (45.4%, a difference of 0.15%), Immigrants from Russia (45.4%, a difference of 0.17%), Immigrants from Denmark (45.4%, a difference of 0.19%), and Immigrants from Latvia (45.1%, a difference of 0.42%).
| Demographics | Rating | Rank | Bachelor's Degree |
| Immigrants | Sri Lanka | 100.0 /100 | #30 | Exceptional 46.1% |
| Latvians | 100.0 /100 | #31 | Exceptional 46.1% |
| Immigrants | Turkey | 100.0 /100 | #32 | Exceptional 46.0% |
| Immigrants | Northern Europe | 100.0 /100 | #33 | Exceptional 45.6% |
| Immigrants | Denmark | 100.0 /100 | #34 | Exceptional 45.4% |
| Immigrants | Russia | 100.0 /100 | #35 | Exceptional 45.4% |
| Mongolians | 100.0 /100 | #36 | Exceptional 45.4% |
| Russians | 100.0 /100 | #37 | Exceptional 45.3% |
| Bulgarians | 100.0 /100 | #38 | Exceptional 45.3% |
| Immigrants | Latvia | 100.0 /100 | #39 | Exceptional 45.1% |
| Immigrants | Belarus | 100.0 /100 | #40 | Exceptional 45.0% |
| Immigrants | Malaysia | 100.0 /100 | #41 | Exceptional 45.0% |
| Immigrants | Saudi Arabia | 100.0 /100 | #42 | Exceptional 44.8% |
| Immigrants | South Africa | 99.9 /100 | #43 | Exceptional 44.8% |
| Immigrants | Lithuania | 99.9 /100 | #44 | Exceptional 44.6% |