Immigrants from Uruguay vs Scandinavian Bachelor's Degree
COMPARE
Immigrants from Uruguay
Scandinavian
Bachelor's Degree
Bachelor's Degree Comparison
Immigrants from Uruguay
Scandinavians
37.8%
BACHELOR'S DEGREE
48.3/ 100
METRIC RATING
175th/ 347
METRIC RANK
37.5%
BACHELOR'S DEGREE
41.7/ 100
METRIC RATING
184th/ 347
METRIC RANK
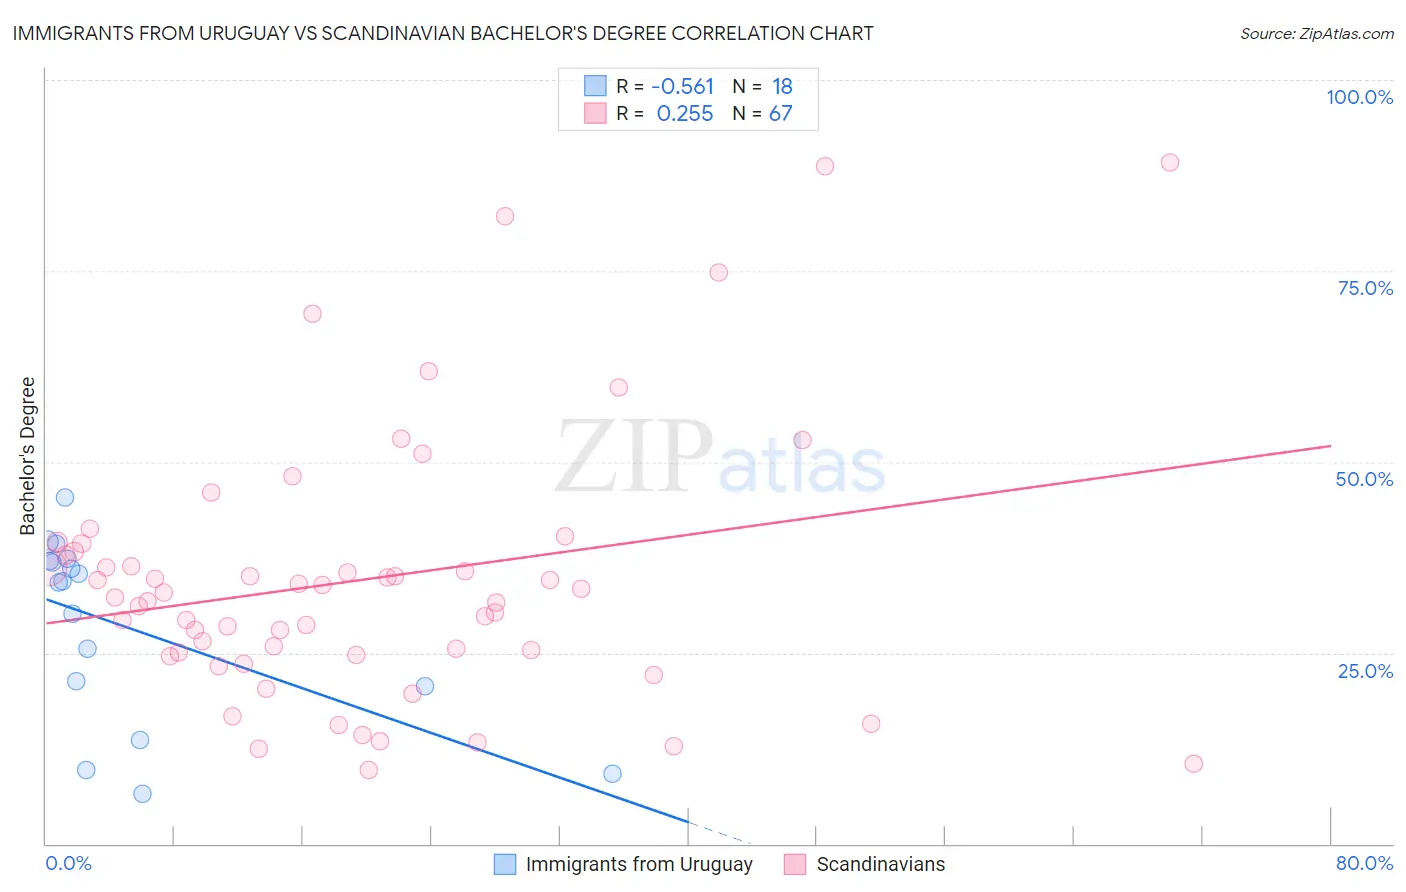
Immigrants from Uruguay vs Scandinavian Bachelor's Degree Correlation Chart
The statistical analysis conducted on geographies consisting of 133,259,667 people shows a substantial negative correlation between the proportion of Immigrants from Uruguay and percentage of population with at least bachelor's degree education in the United States with a correlation coefficient (R) of -0.561 and weighted average of 37.8%. Similarly, the statistical analysis conducted on geographies consisting of 472,607,707 people shows a weak positive correlation between the proportion of Scandinavians and percentage of population with at least bachelor's degree education in the United States with a correlation coefficient (R) of 0.255 and weighted average of 37.5%, a difference of 0.65%.
Bachelor's Degree Correlation Summary
| Measurement | Immigrants from Uruguay | Scandinavian |
| Minimum | 6.5% | 9.7% |
| Maximum | 45.3% | 89.2% |
| Range | 38.8% | 79.4% |
| Mean | 28.4% | 34.6% |
| Median | 34.4% | 32.2% |
| Interquartile 25% (IQ1) | 20.6% | 24.7% |
| Interquartile 75% (IQ3) | 37.0% | 38.3% |
| Interquartile Range (IQR) | 16.4% | 13.5% |
| Standard Deviation (Sample) | 12.1% | 17.4% |
| Standard Deviation (Population) | 11.7% | 17.3% |
Demographics Similar to Immigrants from Uruguay and Scandinavians by Bachelor's Degree
In terms of bachelor's degree, the demographic groups most similar to Immigrants from Uruguay are Costa Rican (37.7%, a difference of 0.080%), Basque (37.7%, a difference of 0.090%), Immigrants from Cameroon (37.7%, a difference of 0.15%), Immigrants from Bangladesh (37.8%, a difference of 0.16%), and Immigrants from Colombia (37.7%, a difference of 0.29%). Similarly, the demographic groups most similar to Scandinavians are Senegalese (37.5%, a difference of 0.040%), Immigrants from Peru (37.5%, a difference of 0.040%), Norwegian (37.5%, a difference of 0.14%), Immigrants from Bosnia and Herzegovina (37.6%, a difference of 0.17%), and Immigrants from Senegal (37.6%, a difference of 0.20%).
| Demographics | Rating | Rank | Bachelor's Degree |
| Ghanaians | 55.3 /100 | #169 | Average 38.0% |
| Czechs | 54.4 /100 | #170 | Average 38.0% |
| Bermudans | 54.2 /100 | #171 | Average 38.0% |
| Immigrants | Somalia | 52.8 /100 | #172 | Average 37.9% |
| Immigrants | Iraq | 52.5 /100 | #173 | Average 37.9% |
| Immigrants | Bangladesh | 50.0 /100 | #174 | Average 37.8% |
| Immigrants | Uruguay | 48.3 /100 | #175 | Average 37.8% |
| Costa Ricans | 47.6 /100 | #176 | Average 37.7% |
| Basques | 47.4 /100 | #177 | Average 37.7% |
| Immigrants | Cameroon | 46.8 /100 | #178 | Average 37.7% |
| Immigrants | Colombia | 45.4 /100 | #179 | Average 37.7% |
| Irish | 44.3 /100 | #180 | Average 37.6% |
| Immigrants | Senegal | 43.8 /100 | #181 | Average 37.6% |
| Immigrants | Bosnia and Herzegovina | 43.4 /100 | #182 | Average 37.6% |
| Senegalese | 42.2 /100 | #183 | Average 37.5% |
| Scandinavians | 41.7 /100 | #184 | Average 37.5% |
| Immigrants | Peru | 41.3 /100 | #185 | Average 37.5% |
| Norwegians | 40.4 /100 | #186 | Average 37.5% |
| English | 39.7 /100 | #187 | Fair 37.4% |
| Immigrants | Oceania | 37.3 /100 | #188 | Fair 37.3% |
| Slovaks | 36.9 /100 | #189 | Fair 37.3% |