Immigrants from Uruguay vs Hawaiian Bachelor's Degree
COMPARE
Immigrants from Uruguay
Hawaiian
Bachelor's Degree
Bachelor's Degree Comparison
Immigrants from Uruguay
Hawaiians
37.8%
BACHELOR'S DEGREE
48.3/ 100
METRIC RATING
175th/ 347
METRIC RANK
31.6%
BACHELOR'S DEGREE
0.1/ 100
METRIC RATING
279th/ 347
METRIC RANK
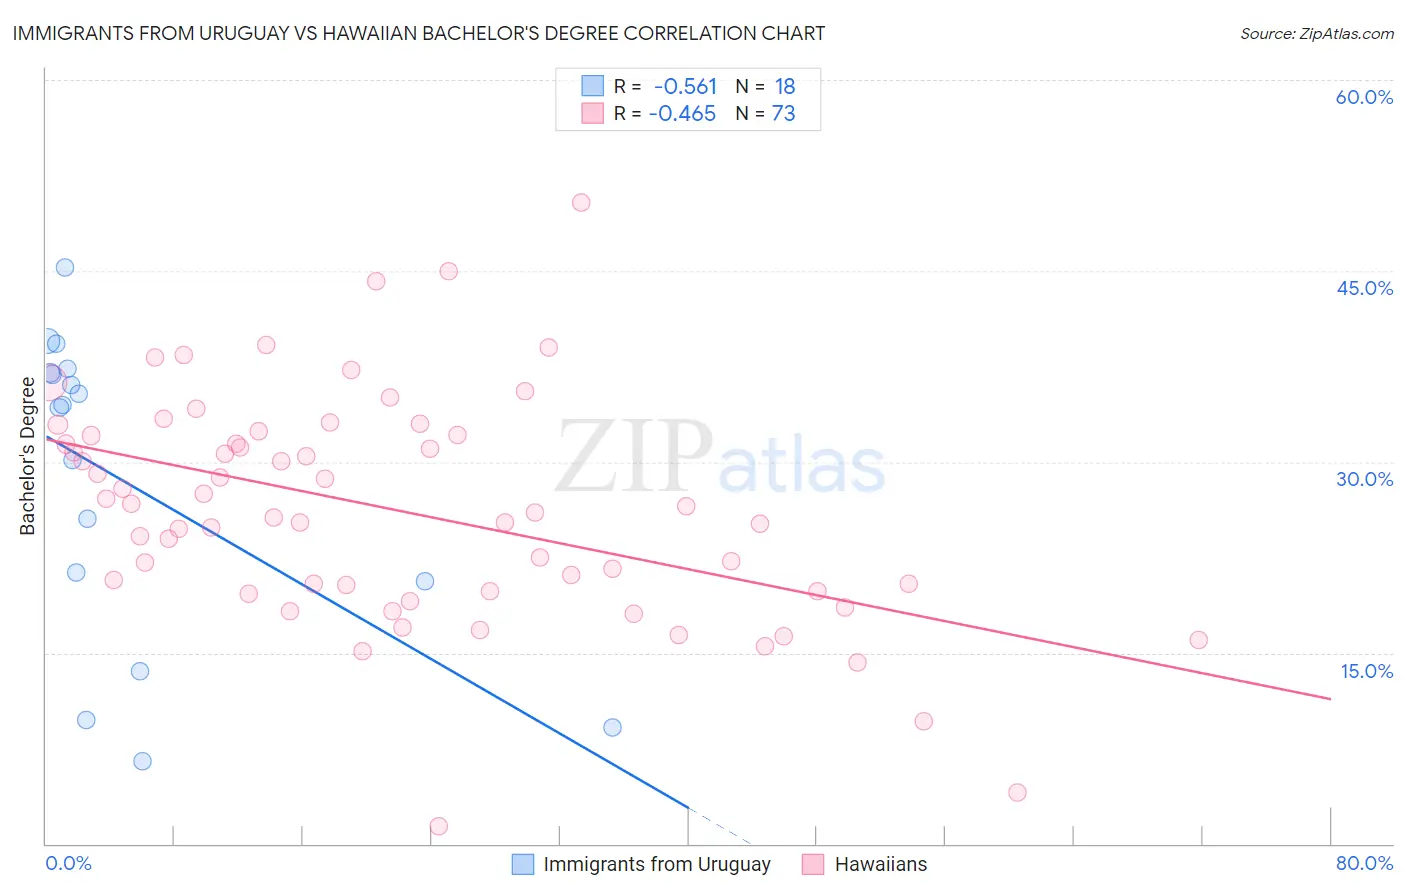
Immigrants from Uruguay vs Hawaiian Bachelor's Degree Correlation Chart
The statistical analysis conducted on geographies consisting of 133,259,667 people shows a substantial negative correlation between the proportion of Immigrants from Uruguay and percentage of population with at least bachelor's degree education in the United States with a correlation coefficient (R) of -0.561 and weighted average of 37.8%. Similarly, the statistical analysis conducted on geographies consisting of 327,580,632 people shows a moderate negative correlation between the proportion of Hawaiians and percentage of population with at least bachelor's degree education in the United States with a correlation coefficient (R) of -0.465 and weighted average of 31.6%, a difference of 19.4%.
Bachelor's Degree Correlation Summary
| Measurement | Immigrants from Uruguay | Hawaiian |
| Minimum | 6.5% | 1.4% |
| Maximum | 45.3% | 50.4% |
| Range | 38.8% | 49.0% |
| Mean | 28.4% | 26.2% |
| Median | 34.4% | 26.0% |
| Interquartile 25% (IQ1) | 20.6% | 19.8% |
| Interquartile 75% (IQ3) | 37.0% | 32.1% |
| Interquartile Range (IQR) | 16.4% | 12.3% |
| Standard Deviation (Sample) | 12.1% | 8.9% |
| Standard Deviation (Population) | 11.7% | 8.9% |
Similar Demographics by Bachelor's Degree
Demographics Similar to Immigrants from Uruguay by Bachelor's Degree
In terms of bachelor's degree, the demographic groups most similar to Immigrants from Uruguay are Costa Rican (37.7%, a difference of 0.080%), Basque (37.7%, a difference of 0.090%), Immigrants from Cameroon (37.7%, a difference of 0.15%), Immigrants from Bangladesh (37.8%, a difference of 0.16%), and Immigrants from Colombia (37.7%, a difference of 0.29%).
| Demographics | Rating | Rank | Bachelor's Degree |
| Danes | 56.2 /100 | #168 | Average 38.1% |
| Ghanaians | 55.3 /100 | #169 | Average 38.0% |
| Czechs | 54.4 /100 | #170 | Average 38.0% |
| Bermudans | 54.2 /100 | #171 | Average 38.0% |
| Immigrants | Somalia | 52.8 /100 | #172 | Average 37.9% |
| Immigrants | Iraq | 52.5 /100 | #173 | Average 37.9% |
| Immigrants | Bangladesh | 50.0 /100 | #174 | Average 37.8% |
| Immigrants | Uruguay | 48.3 /100 | #175 | Average 37.8% |
| Costa Ricans | 47.6 /100 | #176 | Average 37.7% |
| Basques | 47.4 /100 | #177 | Average 37.7% |
| Immigrants | Cameroon | 46.8 /100 | #178 | Average 37.7% |
| Immigrants | Colombia | 45.4 /100 | #179 | Average 37.7% |
| Irish | 44.3 /100 | #180 | Average 37.6% |
| Immigrants | Senegal | 43.8 /100 | #181 | Average 37.6% |
| Immigrants | Bosnia and Herzegovina | 43.4 /100 | #182 | Average 37.6% |
Demographics Similar to Hawaiians by Bachelor's Degree
In terms of bachelor's degree, the demographic groups most similar to Hawaiians are Immigrants from Laos (31.6%, a difference of 0.050%), Marshallese (31.7%, a difference of 0.35%), Dominican (31.8%, a difference of 0.40%), Blackfeet (31.5%, a difference of 0.51%), and Salvadoran (31.8%, a difference of 0.55%).
| Demographics | Rating | Rank | Bachelor's Degree |
| Comanche | 0.2 /100 | #272 | Tragic 31.9% |
| Americans | 0.2 /100 | #273 | Tragic 31.9% |
| Potawatomi | 0.2 /100 | #274 | Tragic 31.9% |
| Samoans | 0.1 /100 | #275 | Tragic 31.8% |
| Salvadorans | 0.1 /100 | #276 | Tragic 31.8% |
| Dominicans | 0.1 /100 | #277 | Tragic 31.8% |
| Marshallese | 0.1 /100 | #278 | Tragic 31.7% |
| Hawaiians | 0.1 /100 | #279 | Tragic 31.6% |
| Immigrants | Laos | 0.1 /100 | #280 | Tragic 31.6% |
| Blackfeet | 0.1 /100 | #281 | Tragic 31.5% |
| Immigrants | Caribbean | 0.1 /100 | #282 | Tragic 31.4% |
| Hondurans | 0.1 /100 | #283 | Tragic 31.3% |
| Haitians | 0.1 /100 | #284 | Tragic 31.3% |
| Aleuts | 0.1 /100 | #285 | Tragic 31.3% |
| Immigrants | El Salvador | 0.1 /100 | #286 | Tragic 31.3% |