Immigrants from Latvia vs Russian Bachelor's Degree
COMPARE
Immigrants from Latvia
Russian
Bachelor's Degree
Bachelor's Degree Comparison
Immigrants from Latvia
Russians
45.1%
BACHELOR'S DEGREE
100.0/ 100
METRIC RATING
39th/ 347
METRIC RANK
45.3%
BACHELOR'S DEGREE
100.0/ 100
METRIC RATING
37th/ 347
METRIC RANK
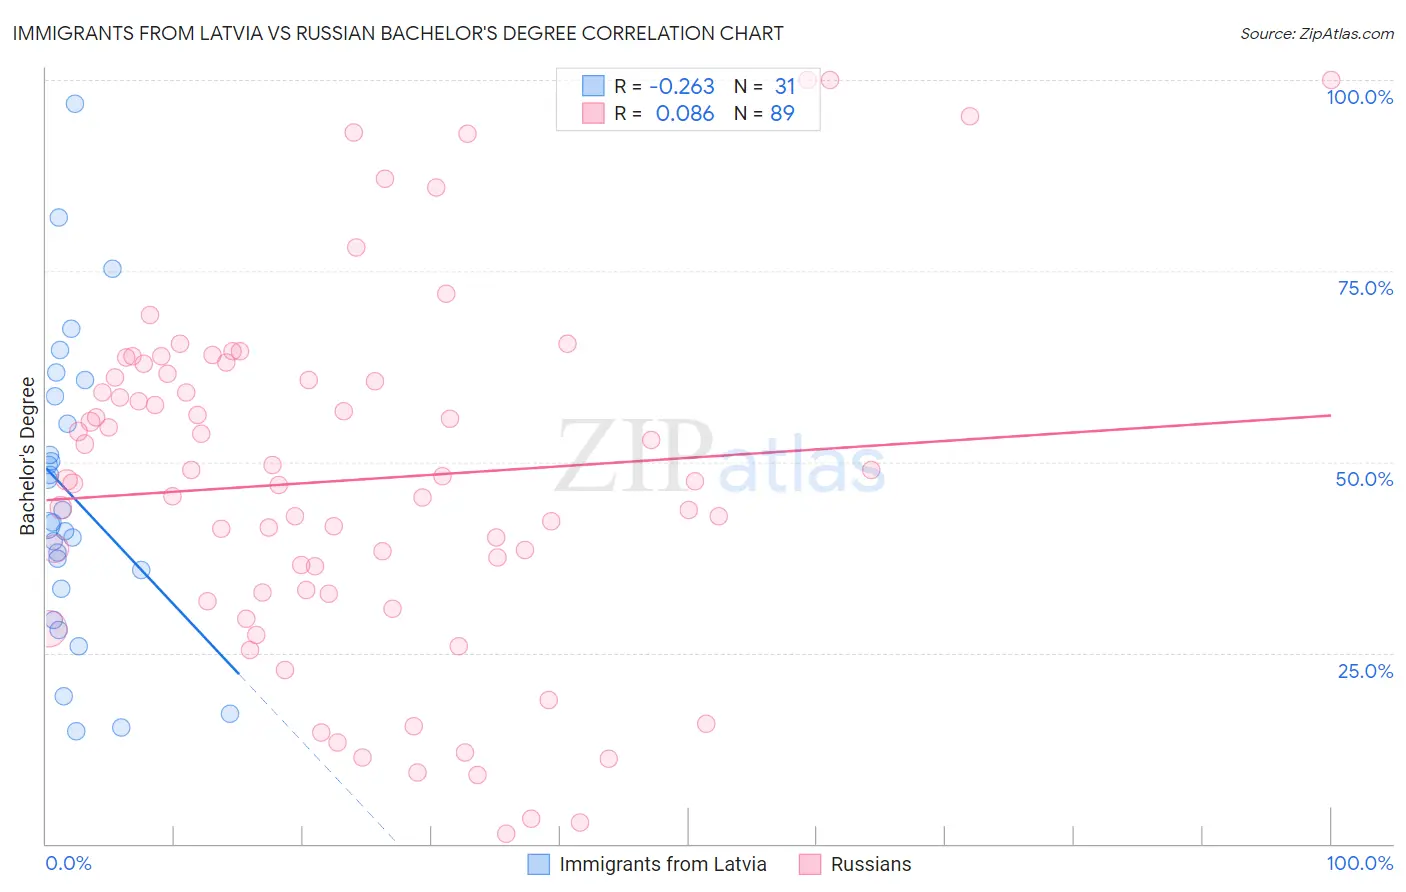
Immigrants from Latvia vs Russian Bachelor's Degree Correlation Chart
The statistical analysis conducted on geographies consisting of 113,735,345 people shows a weak negative correlation between the proportion of Immigrants from Latvia and percentage of population with at least bachelor's degree education in the United States with a correlation coefficient (R) of -0.263 and weighted average of 45.1%. Similarly, the statistical analysis conducted on geographies consisting of 512,185,650 people shows a slight positive correlation between the proportion of Russians and percentage of population with at least bachelor's degree education in the United States with a correlation coefficient (R) of 0.086 and weighted average of 45.3%, a difference of 0.42%.
Bachelor's Degree Correlation Summary
| Measurement | Immigrants from Latvia | Russian |
| Minimum | 14.7% | 1.3% |
| Maximum | 96.9% | 100.0% |
| Range | 82.2% | 98.7% |
| Mean | 45.5% | 47.6% |
| Median | 42.0% | 47.6% |
| Interquartile 25% (IQ1) | 33.3% | 32.8% |
| Interquartile 75% (IQ3) | 58.6% | 61.3% |
| Interquartile Range (IQR) | 25.3% | 28.5% |
| Standard Deviation (Sample) | 19.4% | 23.1% |
| Standard Deviation (Population) | 19.1% | 23.0% |
Demographics Similar to Immigrants from Latvia and Russians by Bachelor's Degree
In terms of bachelor's degree, the demographic groups most similar to Immigrants from Latvia are Immigrants from Belarus (45.0%, a difference of 0.27%), Immigrants from Malaysia (45.0%, a difference of 0.31%), Bulgarian (45.3%, a difference of 0.33%), Mongolian (45.4%, a difference of 0.57%), and Immigrants from Russia (45.4%, a difference of 0.59%). Similarly, the demographic groups most similar to Russians are Bulgarian (45.3%, a difference of 0.090%), Mongolian (45.4%, a difference of 0.15%), Immigrants from Russia (45.4%, a difference of 0.17%), Immigrants from Denmark (45.4%, a difference of 0.19%), and Immigrants from Northern Europe (45.6%, a difference of 0.65%).
| Demographics | Rating | Rank | Bachelor's Degree |
| Turks | 100.0 /100 | #28 | Exceptional 46.2% |
| Israelis | 100.0 /100 | #29 | Exceptional 46.1% |
| Immigrants | Sri Lanka | 100.0 /100 | #30 | Exceptional 46.1% |
| Latvians | 100.0 /100 | #31 | Exceptional 46.1% |
| Immigrants | Turkey | 100.0 /100 | #32 | Exceptional 46.0% |
| Immigrants | Northern Europe | 100.0 /100 | #33 | Exceptional 45.6% |
| Immigrants | Denmark | 100.0 /100 | #34 | Exceptional 45.4% |
| Immigrants | Russia | 100.0 /100 | #35 | Exceptional 45.4% |
| Mongolians | 100.0 /100 | #36 | Exceptional 45.4% |
| Russians | 100.0 /100 | #37 | Exceptional 45.3% |
| Bulgarians | 100.0 /100 | #38 | Exceptional 45.3% |
| Immigrants | Latvia | 100.0 /100 | #39 | Exceptional 45.1% |
| Immigrants | Belarus | 100.0 /100 | #40 | Exceptional 45.0% |
| Immigrants | Malaysia | 100.0 /100 | #41 | Exceptional 45.0% |
| Immigrants | Saudi Arabia | 100.0 /100 | #42 | Exceptional 44.8% |
| Immigrants | South Africa | 99.9 /100 | #43 | Exceptional 44.8% |
| Immigrants | Lithuania | 99.9 /100 | #44 | Exceptional 44.6% |
| Immigrants | Kuwait | 99.9 /100 | #45 | Exceptional 44.6% |
| Immigrants | Bulgaria | 99.9 /100 | #46 | Exceptional 44.6% |
| Bolivians | 99.9 /100 | #47 | Exceptional 44.6% |
| Estonians | 99.9 /100 | #48 | Exceptional 44.6% |