Immigrants from Ukraine vs Welsh GED/Equivalency

COMPARE

Immigrants from Ukraine
Race
Ancestry
AfghanAfricanAlaska NativeAlaskan AthabascanAlbanianAleutAlsatianAmericanApacheArabArapahoArgentineanArmenianAssyrian/Chaldean/SyriacAustralianAustrianBahamianBangladeshiBarbadianBasqueBelgianBelizeanBermudanBhutaneseBlackfeetBolivianBrazilianBritishBritish West IndianBulgarianBurmeseCajunCambodianCanadianCape VerdeanCarpatho RusynCelticCentral AmericanCentral American IndianCherokeeCheyenneChickasawChileanChineseChippewaChoctawColombianColvilleComancheCosta RicanCreeCreekCroatianCrowCubanCypriotCzechCzechoslovakianDanishDelawareDominicanDutchDutch West IndianEastern EuropeanEcuadorianEgyptianEnglishEstonianEthiopianEuropeanFijianFilipinoFinnishFrenchFrench American IndianFrench CanadianGermanGerman RussianGhanaianGreekGuamanian/ChamorroGuatemalanGuyaneseHaitianHmongHonduranHopiHoumaHungarianIcelanderIndian (Asian)IndonesianInupiatIranianIraqiIrishIroquoisIsraeliItalianJamaicanJapaneseJordanianKenyanKiowaKoreanLaotianLatvianLebaneseLiberianLithuanianLumbeeLuxembourgerMacedonianMalaysianMalteseMarshalleseMenomineeMexicanMexican American IndianMongolianMoroccanNative HawaiianNavajoNepaleseNew ZealanderNicaraguanNigerianNorthern EuropeanNorwegianOkinawanOsageOttawaPaiutePakistaniPalestinianPanamanianParaguayanPennsylvania GermanPeruvianPimaPolishPortuguesePotawatomiPuebloPuerto RicanPuget Sound SalishRomanianRussianSalvadoranSamoanScandinavianScotch-IrishScottishSeminoleSenegaleseSerbianShoshoneSierra LeoneanSiouxSlavicSlovakSloveneSomaliSouth AfricanSouth AmericanSouth American IndianSoviet UnionSpaniardSpanishSpanish AmericanSpanish American IndianSri LankanSubsaharan AfricanSudaneseSwedishSwissSyrianTaiwaneseThaiTlingit-HaidaTohono O'OdhamTonganTrinidadian and TobagonianTsimshianTurkishU.S. Virgin IslanderUgandanUkrainianUruguayanUteVenezuelanVietnameseWest IndianYakamaYaquiYugoslavianYumanYup'ikZimbabwean
Immigration
NonimmigrantsImmigrantsAfghanistanAfricaAlbaniaArgentinaArmeniaAsiaAustraliaAustriaBahamasBangladeshBarbadosBelarusBelgiumBelizeBoliviaBosnia and HerzegovinaBrazilBulgariaBurma/MyanmarCabo VerdeCambodiaCameroonCanadaCaribbeanCentral AmericaChileChinaColombiaCongoCosta RicaCroatiaCubaCzechoslovakiaDenmarkDominicaDominican RepublicEastern AfricaEastern AsiaEastern EuropeEcuadorEgyptEl SalvadorEnglandEritreaEthiopiaEuropeFijiFranceGermanyGhanaGreeceGrenadaGuatemalaGuyanaHaitiHondurasHong KongHungaryIndiaIndonesiaIranIraqIrelandIsraelItalyJamaicaJapanJordanKazakhstanKenyaKoreaKuwaitLaosLatin AmericaLatviaLebanonLiberiaLithuaniaMalaysiaMexicoMicronesiaMiddle AfricaMoldovaMoroccoNepalNetherlandsNicaraguaNigeriaNorth AmericaNorth MacedoniaNorthern AfricaNorthern EuropeNorwayOceaniaPakistanPanamaPeruPhilippinesPolandPortugalRomaniaRussiaSaudi ArabiaScotlandSenegalSerbiaSierra LeoneSingaporeSomaliaSouth AfricaSouth AmericaSouth Central AsiaSouth Eastern AsiaSouthern EuropeSpainSri LankaSt. Vincent and the GrenadinesSudanSwedenSwitzerlandSyriaTaiwanThailandTrinidad and TobagoTurkeyUgandaUkraineUruguayUzbekistanVenezuelaVietnamWest IndiesWestern AfricaWestern AsiaWestern EuropeYemenZaireZimbabweAzores
Welsh
Race
Ancestry
AfghanAfricanAlaska NativeAlaskan AthabascanAlbanianAleutAlsatianAmericanApacheArabArapahoArgentineanArmenianAssyrian/Chaldean/SyriacAustralianAustrianBahamianBangladeshiBarbadianBasqueBelgianBelizeanBermudanBhutaneseBlackfeetBolivianBrazilianBritishBritish West IndianBulgarianBurmeseCajunCambodianCanadianCape VerdeanCarpatho RusynCelticCentral AmericanCentral American IndianCherokeeCheyenneChickasawChileanChineseChippewaChoctawColombianColvilleComancheCosta RicanCreeCreekCroatianCrowCubanCypriotCzechCzechoslovakianDanishDelawareDominicanDutchDutch West IndianEastern EuropeanEcuadorianEgyptianEnglishEstonianEthiopianEuropeanFijianFilipinoFinnishFrenchFrench American IndianFrench CanadianGermanGerman RussianGhanaianGreekGuamanian/ChamorroGuatemalanGuyaneseHaitianHmongHonduranHopiHoumaHungarianIcelanderIndian (Asian)IndonesianInupiatIranianIraqiIrishIroquoisIsraeliItalianJamaicanJapaneseJordanianKenyanKiowaKoreanLaotianLatvianLebaneseLiberianLithuanianLumbeeLuxembourgerMacedonianMalaysianMalteseMarshalleseMenomineeMexicanMexican American IndianMongolianMoroccanNative HawaiianNavajoNepaleseNew ZealanderNicaraguanNigerianNorthern EuropeanNorwegianOkinawanOsageOttawaPaiutePakistaniPalestinianPanamanianParaguayanPennsylvania GermanPeruvianPimaPolishPortuguesePotawatomiPuebloPuerto RicanPuget Sound SalishRomanianRussianSalvadoranSamoanScandinavianScotch-IrishScottishSeminoleSenegaleseSerbianShoshoneSierra LeoneanSiouxSlavicSlovakSloveneSomaliSouth AfricanSouth AmericanSouth American IndianSoviet UnionSpaniardSpanishSpanish AmericanSpanish American IndianSri LankanSubsaharan AfricanSudaneseSwedishSwissSyrianTaiwaneseThaiTlingit-HaidaTohono O'OdhamTonganTrinidadian and TobagonianTsimshianTurkishU.S. Virgin IslanderUgandanUkrainianUruguayanUteVenezuelanVietnameseWelshWest IndianYakamaYaquiYugoslavianYumanYup'ikZimbabwean
Immigration
NonimmigrantsImmigrantsAfghanistanAfricaAlbaniaArgentinaArmeniaAsiaAustraliaAustriaBahamasBangladeshBarbadosBelarusBelgiumBelizeBoliviaBosnia and HerzegovinaBrazilBulgariaBurma/MyanmarCabo VerdeCambodiaCameroonCanadaCaribbeanCentral AmericaChileChinaColombiaCongoCosta RicaCroatiaCubaCzechoslovakiaDenmarkDominicaDominican RepublicEastern AfricaEastern AsiaEastern EuropeEcuadorEgyptEl SalvadorEnglandEritreaEthiopiaEuropeFijiFranceGermanyGhanaGreeceGrenadaGuatemalaGuyanaHaitiHondurasHong KongHungaryIndiaIndonesiaIranIraqIrelandIsraelItalyJamaicaJapanJordanKazakhstanKenyaKoreaKuwaitLaosLatin AmericaLatviaLebanonLiberiaLithuaniaMalaysiaMexicoMicronesiaMiddle AfricaMoldovaMoroccoNepalNetherlandsNicaraguaNigeriaNorth AmericaNorth MacedoniaNorthern AfricaNorthern EuropeNorwayOceaniaPakistanPanamaPeruPhilippinesPolandPortugalRomaniaRussiaSaudi ArabiaScotlandSenegalSerbiaSierra LeoneSingaporeSomaliaSouth AfricaSouth AmericaSouth Central AsiaSouth Eastern AsiaSouthern EuropeSpainSri LankaSt. Vincent and the GrenadinesSudanSwedenSwitzerlandSyriaTaiwanThailandTrinidad and TobagoTurkeyUgandaUruguayUzbekistanVenezuelaVietnamWest IndiesWestern AfricaWestern AsiaWestern EuropeYemenZaireZimbabweAzores
GED/Equivalency
Income
Poverty
Unemployment
Labor Participation
Family Structure
Vehicle Availability
Education Level
Disability

GED/Equivalency Comparison

Immigrants from Ukraine

Welsh

Excellent
Exceptional
86.7%
GED/EQUIVALENCY
88.9/ 100
METRIC RATING
129th/ 347
METRIC RANK
87.4%
GED/EQUIVALENCY
97.9/ 100
METRIC RATING
90th/ 347
METRIC RANK

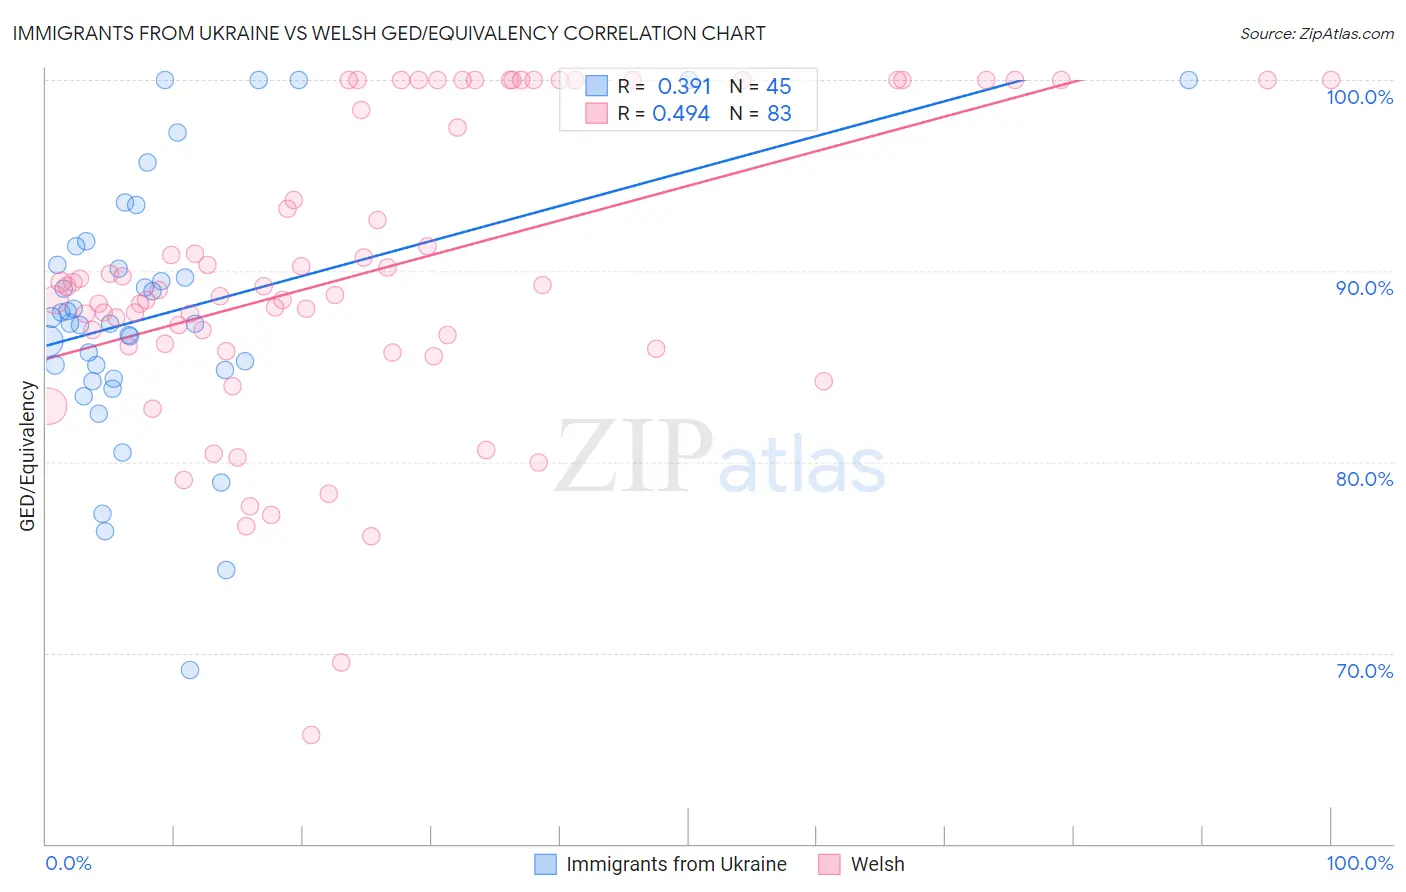
Immigrants from Ukraine vs Welsh GED/Equivalency Correlation Chart

The statistical analysis conducted on geographies consisting of 289,714,613 people shows a mild positive correlation between the proportion of Immigrants from Ukraine and percentage of population with at least ged/equivalency education in the United States with a correlation coefficient (R) of 0.391 and weighted average of 86.7%. Similarly, the statistical analysis conducted on geographies consisting of 528,596,196 people shows a moderate positive correlation between the proportion of Welsh and percentage of population with at least ged/equivalency education in the United States with a correlation coefficient (R) of 0.494 and weighted average of 87.4%, a difference of 0.89%.
Immigrants from Ukraine vs Welsh GED/Equivalency

GED/Equivalency Correlation Summary

MeasurementImmigrants from UkraineWelsh
Minimum69.1%65.7%
Maximum100.0%100.0%
Range30.9%34.3%
Mean87.8%90.0%
Median87.3%89.2%
Interquartile 25% (IQ1)84.6%86.1%
Interquartile 75% (IQ3)90.8%100.0%
Interquartile Range (IQR)6.2%13.9%
Standard Deviation (Sample)6.8%7.9%
Standard Deviation (Population)6.7%7.8%

Similar Demographics by GED/Equivalency

Demographics Similar to Immigrants from Ukraine by GED/Equivalency

In terms of ged/equivalency, the demographic groups most similar to Immigrants from Ukraine are Immigrants from Germany (86.7%, a difference of 0.0%), Immigrants from Spain (86.7%, a difference of 0.020%), Yugoslavian (86.7%, a difference of 0.030%), Immigrants from Brazil (86.6%, a difference of 0.030%), and Tsimshian (86.6%, a difference of 0.030%).
DemographicsRating | RankGED/Equivalency
Immigrants | Jordan
90.8
/100
|
#122
Exceptional
86.8%
Immigrants | Italy
90.5
/100
|
#123
Exceptional
86.7%
Immigrants | Egypt
90.4
/100
|
#124
Exceptional
86.7%
Celtics
90.4
/100
|
#125
Exceptional
86.7%
Asians
90.3
/100
|
#126
Exceptional
86.7%
Argentineans
89.7
/100
|
#127
Excellent
86.7%
Yugoslavians
89.5
/100
|
#128
Excellent
86.7%
Immigrants | Ukraine
88.9
/100
|
#129
Excellent
86.7%
Immigrants | Germany
88.8
/100
|
#130
Excellent
86.7%
Immigrants | Spain
88.5
/100
|
#131
Excellent
86.7%
Immigrants | Brazil
88.4
/100
|
#132
Excellent
86.6%
Tsimshian
88.3
/100
|
#133
Excellent
86.6%
Albanians
87.7
/100
|
#134
Excellent
86.6%
Immigrants | Asia
87.4
/100
|
#135
Excellent
86.6%
Chileans
86.9
/100
|
#136
Excellent
86.6%

Demographics Similar to Welsh by GED/Equivalency

In terms of ged/equivalency, the demographic groups most similar to Welsh are Hungarian (87.4%, a difference of 0.0%), Immigrants from Eastern Asia (87.4%, a difference of 0.010%), Israeli (87.4%, a difference of 0.020%), Immigrants from North Macedonia (87.4%, a difference of 0.030%), and Immigrants from Russia (87.4%, a difference of 0.030%).
DemographicsRating | RankGED/Equivalency
South Africans
98.3
/100
|
#83
Exceptional
87.5%
Immigrants | Romania
98.1
/100
|
#84
Exceptional
87.5%
Dutch
98.1
/100
|
#85
Exceptional
87.5%
Immigrants | Europe
98.1
/100
|
#86
Exceptional
87.5%
Native Hawaiians
98.1
/100
|
#87
Exceptional
87.5%
Immigrants | Norway
98.1
/100
|
#88
Exceptional
87.5%
Hungarians
97.9
/100
|
#89
Exceptional
87.4%
Welsh
97.9
/100
|
#90
Exceptional
87.4%
Immigrants | Eastern Asia
97.9
/100
|
#91
Exceptional
87.4%
Israelis
97.8
/100
|
#92
Exceptional
87.4%
Immigrants | North Macedonia
97.8
/100
|
#93
Exceptional
87.4%
Immigrants | Russia
97.8
/100
|
#94
Exceptional
87.4%
Immigrants | Greece
97.7
/100
|
#95
Exceptional
87.4%
Czechoslovakians
97.6
/100
|
#96
Exceptional
87.4%
Immigrants | Western Europe
97.3
/100
|
#97
Exceptional
87.3%