Immigrants from Ukraine vs Welsh Associate's Degree
COMPARE
Immigrants from Ukraine
Welsh
Associate's Degree
Associate's Degree Comparison
Immigrants from Ukraine
Welsh
49.7%
ASSOCIATE'S DEGREE
98.0/ 100
METRIC RATING
97th/ 347
METRIC RANK
45.9%
ASSOCIATE'S DEGREE
37.9/ 100
METRIC RATING
186th/ 347
METRIC RANK
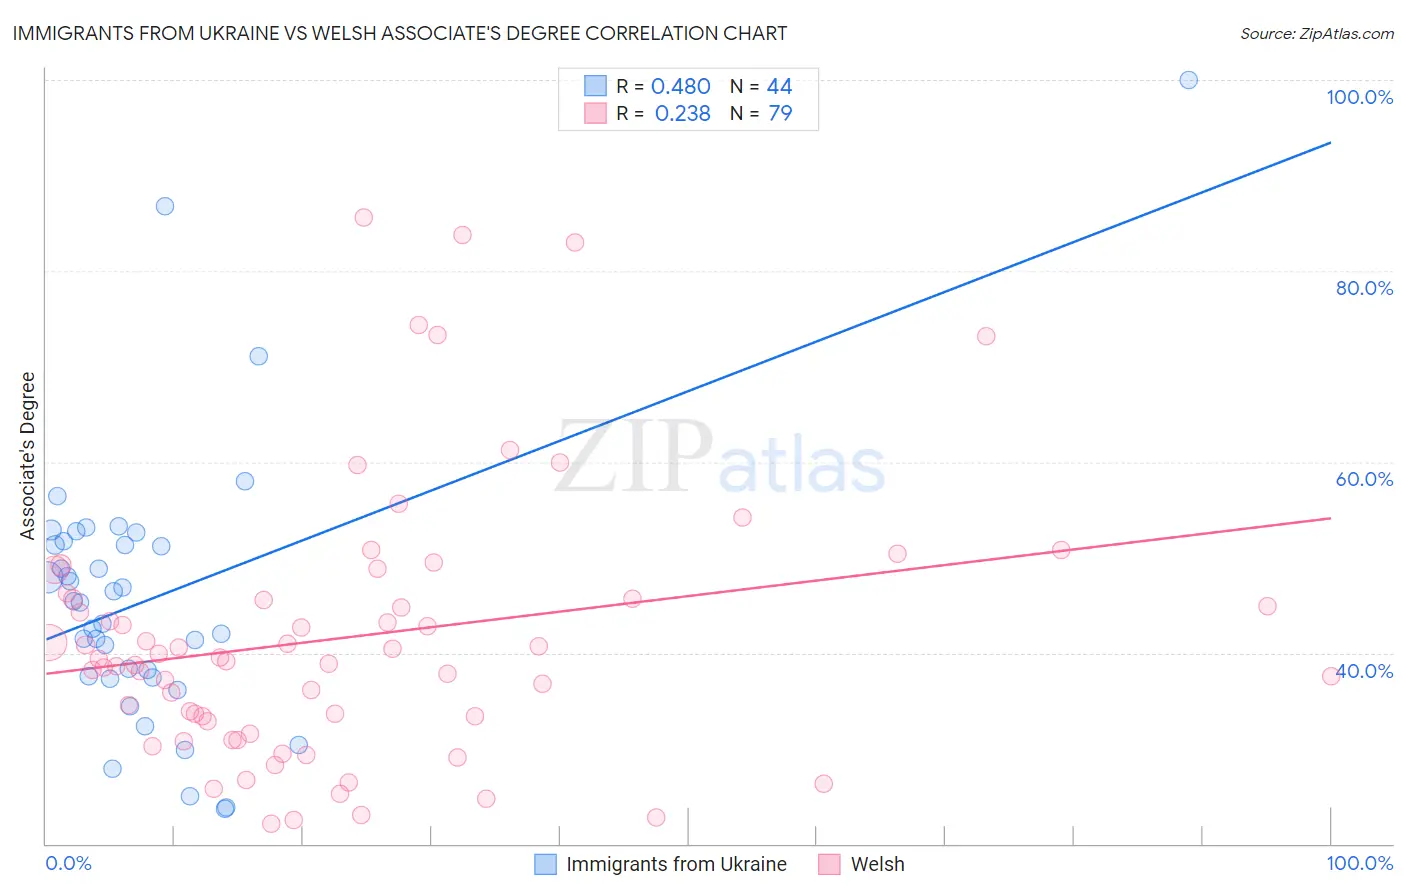
Immigrants from Ukraine vs Welsh Associate's Degree Correlation Chart
The statistical analysis conducted on geographies consisting of 289,711,904 people shows a moderate positive correlation between the proportion of Immigrants from Ukraine and percentage of population with at least associate's degree education in the United States with a correlation coefficient (R) of 0.480 and weighted average of 49.7%. Similarly, the statistical analysis conducted on geographies consisting of 528,554,894 people shows a weak positive correlation between the proportion of Welsh and percentage of population with at least associate's degree education in the United States with a correlation coefficient (R) of 0.238 and weighted average of 45.9%, a difference of 8.3%.
Associate's Degree Correlation Summary
| Measurement | Immigrants from Ukraine | Welsh |
| Minimum | 23.7% | 22.1% |
| Maximum | 100.0% | 85.6% |
| Range | 76.3% | 63.5% |
| Mean | 45.7% | 41.7% |
| Median | 45.3% | 39.4% |
| Interquartile 25% (IQ1) | 37.5% | 32.9% |
| Interquartile 75% (IQ3) | 51.5% | 45.7% |
| Interquartile Range (IQR) | 14.0% | 12.8% |
| Standard Deviation (Sample) | 14.5% | 14.0% |
| Standard Deviation (Population) | 14.3% | 13.9% |
Similar Demographics by Associate's Degree
Demographics Similar to Immigrants from Ukraine by Associate's Degree
In terms of associate's degree, the demographic groups most similar to Immigrants from Ukraine are Romanian (49.7%, a difference of 0.0%), Immigrants from England (49.7%, a difference of 0.020%), Immigrants from Northern Africa (49.7%, a difference of 0.090%), Macedonian (49.6%, a difference of 0.16%), and Immigrants from Nepal (49.5%, a difference of 0.38%).
| Demographics | Rating | Rank | Associate's Degree |
| Immigrants | Ethiopia | 98.7 /100 | #90 | Exceptional 50.1% |
| Immigrants | Western Asia | 98.7 /100 | #91 | Exceptional 50.1% |
| Immigrants | North America | 98.7 /100 | #92 | Exceptional 50.1% |
| Immigrants | Brazil | 98.5 /100 | #93 | Exceptional 50.0% |
| Laotians | 98.4 /100 | #94 | Exceptional 49.9% |
| Immigrants | England | 98.0 /100 | #95 | Exceptional 49.7% |
| Romanians | 98.0 /100 | #96 | Exceptional 49.7% |
| Immigrants | Ukraine | 98.0 /100 | #97 | Exceptional 49.7% |
| Immigrants | Northern Africa | 97.9 /100 | #98 | Exceptional 49.7% |
| Macedonians | 97.8 /100 | #99 | Exceptional 49.6% |
| Immigrants | Nepal | 97.5 /100 | #100 | Exceptional 49.5% |
| Northern Europeans | 97.3 /100 | #101 | Exceptional 49.5% |
| Chileans | 97.3 /100 | #102 | Exceptional 49.4% |
| Ukrainians | 97.1 /100 | #103 | Exceptional 49.4% |
| Venezuelans | 97.0 /100 | #104 | Exceptional 49.4% |
Demographics Similar to Welsh by Associate's Degree
In terms of associate's degree, the demographic groups most similar to Welsh are Costa Rican (46.0%, a difference of 0.060%), Czechoslovakian (46.0%, a difference of 0.17%), Yugoslavian (46.0%, a difference of 0.19%), Swiss (46.0%, a difference of 0.20%), and Immigrants from Uruguay (45.8%, a difference of 0.20%).
| Demographics | Rating | Rank | Associate's Degree |
| Sri Lankans | 47.6 /100 | #179 | Average 46.3% |
| Bermudans | 46.4 /100 | #180 | Average 46.2% |
| Immigrants | Colombia | 41.3 /100 | #181 | Average 46.0% |
| Swiss | 40.4 /100 | #182 | Average 46.0% |
| Yugoslavians | 40.2 /100 | #183 | Average 46.0% |
| Czechoslovakians | 40.0 /100 | #184 | Average 46.0% |
| Costa Ricans | 38.6 /100 | #185 | Fair 46.0% |
| Welsh | 37.9 /100 | #186 | Fair 45.9% |
| Immigrants | Uruguay | 35.5 /100 | #187 | Fair 45.8% |
| Ghanaians | 35.5 /100 | #188 | Fair 45.8% |
| Immigrants | Oceania | 34.7 /100 | #189 | Fair 45.8% |
| Vietnamese | 34.0 /100 | #190 | Fair 45.8% |
| Koreans | 33.8 /100 | #191 | Fair 45.8% |
| Celtics | 33.3 /100 | #192 | Fair 45.8% |
| Immigrants | Cameroon | 31.0 /100 | #193 | Fair 45.7% |