Immigrants from Ukraine vs Welsh Cognitive Disability
COMPARE
Immigrants from Ukraine
Welsh
Cognitive Disability
Cognitive Disability Comparison
Immigrants from Ukraine
Welsh
16.6%
COGNITIVE DISABILITY
99.5/ 100
METRIC RATING
66th/ 347
METRIC RANK
17.0%
COGNITIVE DISABILITY
90.8/ 100
METRIC RATING
138th/ 347
METRIC RANK
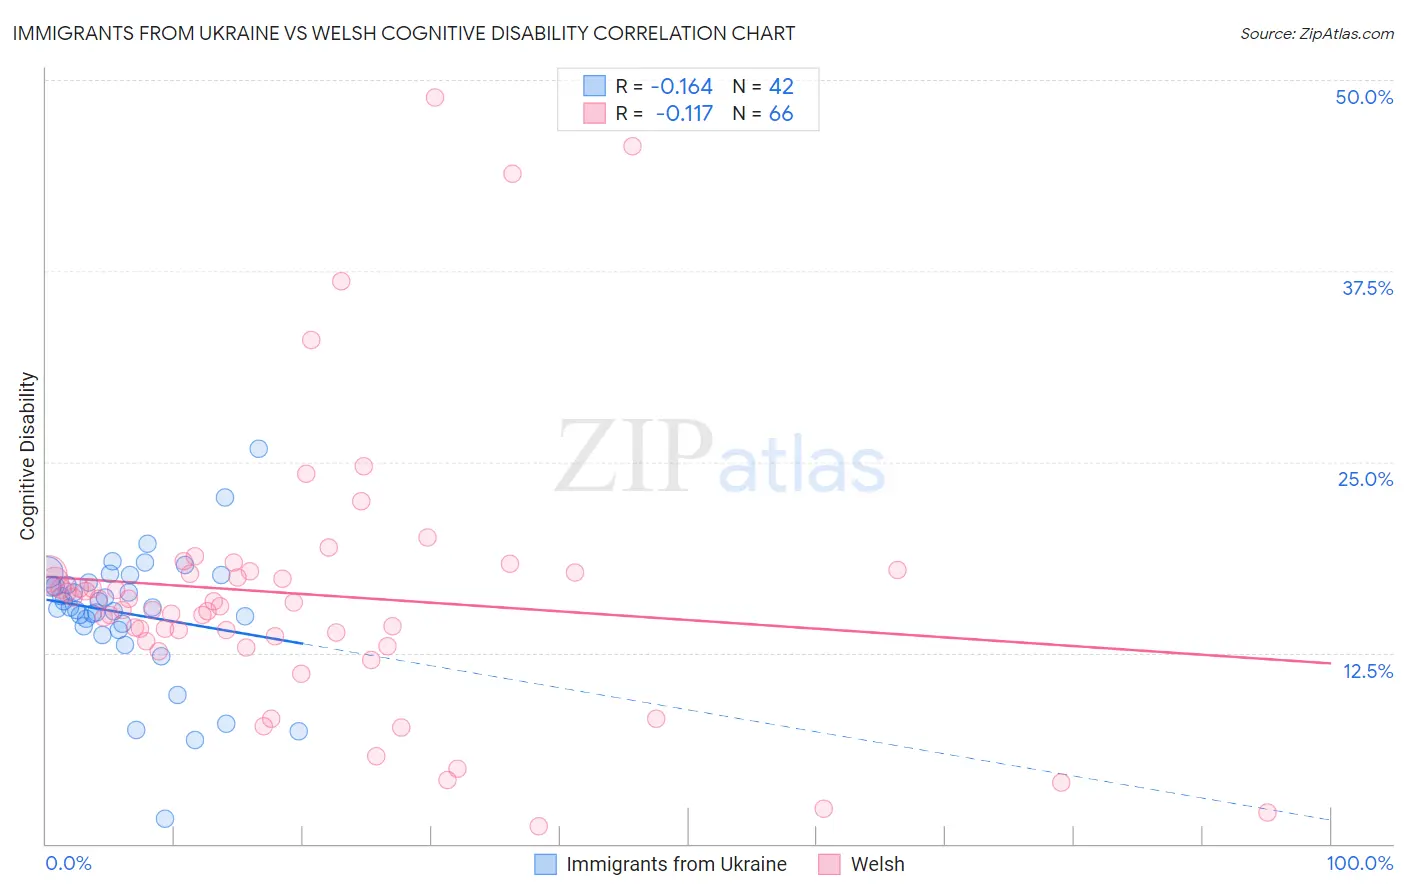
Immigrants from Ukraine vs Welsh Cognitive Disability Correlation Chart
The statistical analysis conducted on geographies consisting of 289,689,881 people shows a poor negative correlation between the proportion of Immigrants from Ukraine and percentage of population with cognitive disability in the United States with a correlation coefficient (R) of -0.164 and weighted average of 16.6%. Similarly, the statistical analysis conducted on geographies consisting of 528,521,772 people shows a poor negative correlation between the proportion of Welsh and percentage of population with cognitive disability in the United States with a correlation coefficient (R) of -0.117 and weighted average of 17.0%, a difference of 2.2%.
Cognitive Disability Correlation Summary
| Measurement | Immigrants from Ukraine | Welsh |
| Minimum | 1.6% | 1.2% |
| Maximum | 25.9% | 48.8% |
| Range | 24.3% | 47.7% |
| Mean | 15.1% | 16.3% |
| Median | 15.5% | 15.7% |
| Interquartile 25% (IQ1) | 14.3% | 13.2% |
| Interquartile 75% (IQ3) | 17.1% | 17.8% |
| Interquartile Range (IQR) | 2.9% | 4.5% |
| Standard Deviation (Sample) | 4.2% | 8.9% |
| Standard Deviation (Population) | 4.2% | 8.9% |
Similar Demographics by Cognitive Disability
Demographics Similar to Immigrants from Ukraine by Cognitive Disability
In terms of cognitive disability, the demographic groups most similar to Immigrants from Ukraine are Latvian (16.6%, a difference of 0.040%), Ukrainian (16.6%, a difference of 0.080%), Colombian (16.6%, a difference of 0.12%), Venezuelan (16.6%, a difference of 0.14%), and Immigrants from Uzbekistan (16.7%, a difference of 0.16%).
| Demographics | Rating | Rank | Cognitive Disability |
| Immigrants | Peru | 99.7 /100 | #59 | Exceptional 16.6% |
| Romanians | 99.7 /100 | #60 | Exceptional 16.6% |
| Immigrants | England | 99.6 /100 | #61 | Exceptional 16.6% |
| Czechoslovakians | 99.6 /100 | #62 | Exceptional 16.6% |
| Argentineans | 99.6 /100 | #63 | Exceptional 16.6% |
| Venezuelans | 99.6 /100 | #64 | Exceptional 16.6% |
| Colombians | 99.6 /100 | #65 | Exceptional 16.6% |
| Immigrants | Ukraine | 99.5 /100 | #66 | Exceptional 16.6% |
| Latvians | 99.5 /100 | #67 | Exceptional 16.6% |
| Ukrainians | 99.4 /100 | #68 | Exceptional 16.6% |
| Immigrants | Uzbekistan | 99.4 /100 | #69 | Exceptional 16.7% |
| Immigrants | Sweden | 99.4 /100 | #70 | Exceptional 16.7% |
| Immigrants | Belgium | 99.3 /100 | #71 | Exceptional 16.7% |
| Germans | 99.3 /100 | #72 | Exceptional 16.7% |
| Burmese | 99.3 /100 | #73 | Exceptional 16.7% |
Demographics Similar to Welsh by Cognitive Disability
In terms of cognitive disability, the demographic groups most similar to Welsh are Israeli (17.0%, a difference of 0.020%), Immigrants from Norway (17.0%, a difference of 0.020%), Lebanese (17.0%, a difference of 0.050%), French (17.0%, a difference of 0.070%), and Chilean (17.0%, a difference of 0.070%).
| Demographics | Rating | Rank | Cognitive Disability |
| Immigrants | Germany | 92.1 /100 | #131 | Exceptional 17.0% |
| Whites/Caucasians | 92.1 /100 | #132 | Exceptional 17.0% |
| Immigrants | Jordan | 91.9 /100 | #133 | Exceptional 17.0% |
| Immigrants | Chile | 91.7 /100 | #134 | Exceptional 17.0% |
| Lebanese | 91.3 /100 | #135 | Exceptional 17.0% |
| Israelis | 91.0 /100 | #136 | Exceptional 17.0% |
| Immigrants | Norway | 90.9 /100 | #137 | Exceptional 17.0% |
| Welsh | 90.8 /100 | #138 | Exceptional 17.0% |
| French | 90.0 /100 | #139 | Excellent 17.0% |
| Chileans | 89.9 /100 | #140 | Excellent 17.0% |
| Aleuts | 89.9 /100 | #141 | Excellent 17.0% |
| Carpatho Rusyns | 89.6 /100 | #142 | Excellent 17.0% |
| British | 89.3 /100 | #143 | Excellent 17.0% |
| Immigrants | Brazil | 89.3 /100 | #144 | Excellent 17.0% |
| Immigrants | South Eastern Asia | 88.7 /100 | #145 | Excellent 17.0% |