Colombian vs Welsh Associate's Degree
COMPARE
Colombian
Welsh
Associate's Degree
Associate's Degree Comparison
Colombians
Welsh
46.8%
ASSOCIATE'S DEGREE
62.4/ 100
METRIC RATING
164th/ 347
METRIC RANK
45.9%
ASSOCIATE'S DEGREE
37.9/ 100
METRIC RATING
186th/ 347
METRIC RANK
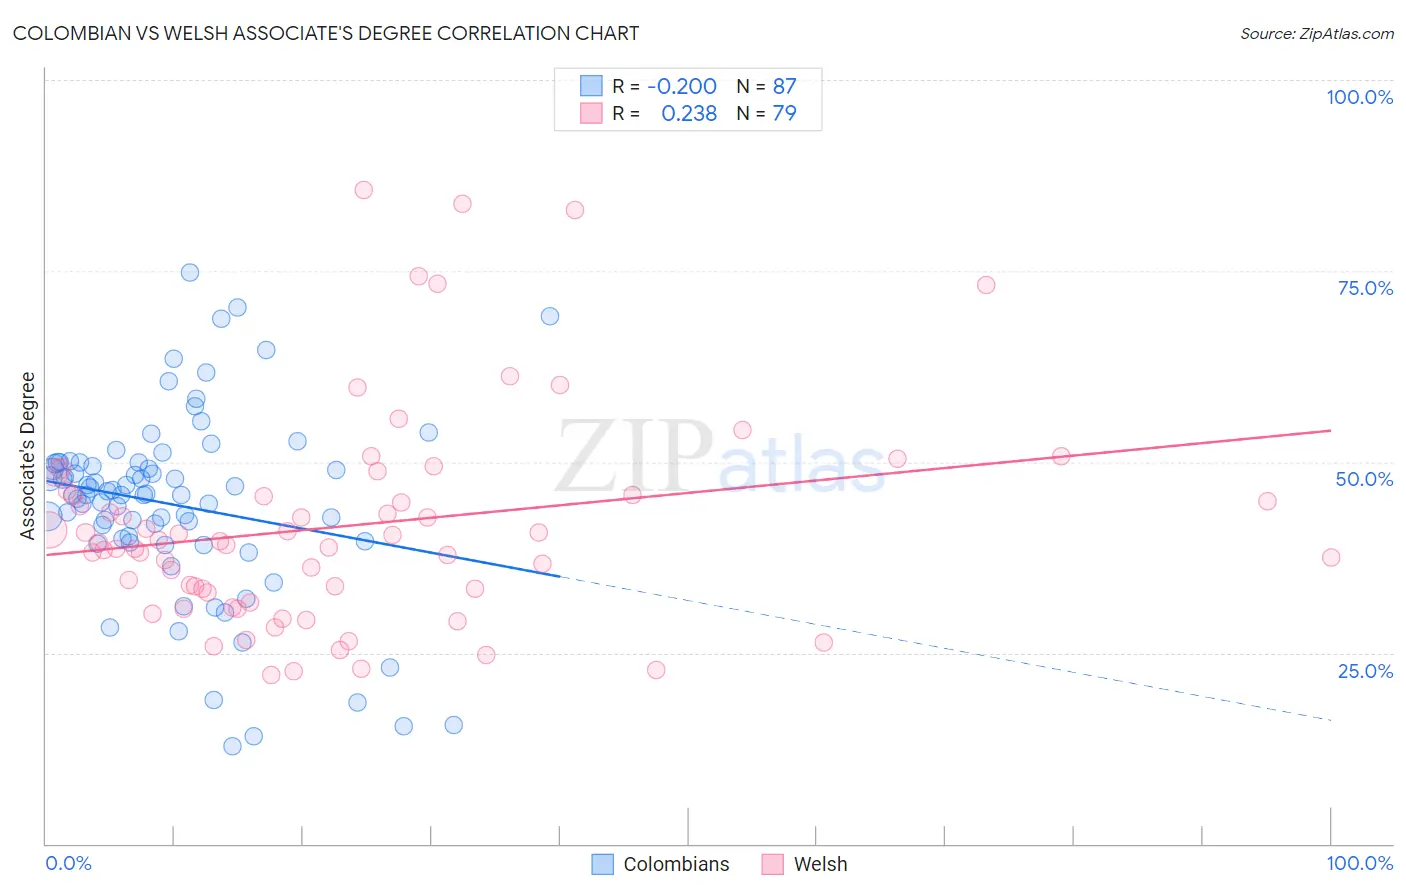
Colombian vs Welsh Associate's Degree Correlation Chart
The statistical analysis conducted on geographies consisting of 419,659,293 people shows a weak negative correlation between the proportion of Colombians and percentage of population with at least associate's degree education in the United States with a correlation coefficient (R) of -0.200 and weighted average of 46.8%. Similarly, the statistical analysis conducted on geographies consisting of 528,554,894 people shows a weak positive correlation between the proportion of Welsh and percentage of population with at least associate's degree education in the United States with a correlation coefficient (R) of 0.238 and weighted average of 45.9%, a difference of 1.9%.
Associate's Degree Correlation Summary
| Measurement | Colombian | Welsh |
| Minimum | 12.8% | 22.1% |
| Maximum | 74.8% | 85.6% |
| Range | 62.0% | 63.5% |
| Mean | 44.4% | 41.7% |
| Median | 45.7% | 39.4% |
| Interquartile 25% (IQ1) | 39.6% | 32.9% |
| Interquartile 75% (IQ3) | 49.8% | 45.7% |
| Interquartile Range (IQR) | 10.3% | 12.8% |
| Standard Deviation (Sample) | 12.2% | 14.0% |
| Standard Deviation (Population) | 12.1% | 13.9% |
Similar Demographics by Associate's Degree
Demographics Similar to Colombians by Associate's Degree
In terms of associate's degree, the demographic groups most similar to Colombians are Somali (46.8%, a difference of 0.010%), Immigrants from Africa (46.8%, a difference of 0.060%), Immigrants from South America (46.7%, a difference of 0.20%), Scandinavian (46.9%, a difference of 0.23%), and Scottish (46.9%, a difference of 0.24%).
| Demographics | Rating | Rank | Associate's Degree |
| Sudanese | 70.3 /100 | #157 | Good 47.1% |
| Immigrants | Germany | 69.7 /100 | #158 | Good 47.1% |
| Immigrants | Poland | 69.2 /100 | #159 | Good 47.1% |
| Scottish | 65.4 /100 | #160 | Good 46.9% |
| Scandinavians | 65.2 /100 | #161 | Good 46.9% |
| Immigrants | Africa | 63.2 /100 | #162 | Good 46.8% |
| Somalis | 62.5 /100 | #163 | Good 46.8% |
| Colombians | 62.4 /100 | #164 | Good 46.8% |
| Immigrants | South America | 59.9 /100 | #165 | Average 46.7% |
| Hungarians | 59.3 /100 | #166 | Average 46.7% |
| Immigrants | Sierra Leone | 59.2 /100 | #167 | Average 46.7% |
| Immigrants | Somalia | 55.5 /100 | #168 | Average 46.5% |
| Uruguayans | 55.4 /100 | #169 | Average 46.5% |
| Irish | 53.6 /100 | #170 | Average 46.5% |
| Basques | 52.8 /100 | #171 | Average 46.5% |
Demographics Similar to Welsh by Associate's Degree
In terms of associate's degree, the demographic groups most similar to Welsh are Costa Rican (46.0%, a difference of 0.060%), Czechoslovakian (46.0%, a difference of 0.17%), Yugoslavian (46.0%, a difference of 0.19%), Swiss (46.0%, a difference of 0.20%), and Immigrants from Uruguay (45.8%, a difference of 0.20%).
| Demographics | Rating | Rank | Associate's Degree |
| Sri Lankans | 47.6 /100 | #179 | Average 46.3% |
| Bermudans | 46.4 /100 | #180 | Average 46.2% |
| Immigrants | Colombia | 41.3 /100 | #181 | Average 46.0% |
| Swiss | 40.4 /100 | #182 | Average 46.0% |
| Yugoslavians | 40.2 /100 | #183 | Average 46.0% |
| Czechoslovakians | 40.0 /100 | #184 | Average 46.0% |
| Costa Ricans | 38.6 /100 | #185 | Fair 46.0% |
| Welsh | 37.9 /100 | #186 | Fair 45.9% |
| Immigrants | Uruguay | 35.5 /100 | #187 | Fair 45.8% |
| Ghanaians | 35.5 /100 | #188 | Fair 45.8% |
| Immigrants | Oceania | 34.7 /100 | #189 | Fair 45.8% |
| Vietnamese | 34.0 /100 | #190 | Fair 45.8% |
| Koreans | 33.8 /100 | #191 | Fair 45.8% |
| Celtics | 33.3 /100 | #192 | Fair 45.8% |
| Immigrants | Cameroon | 31.0 /100 | #193 | Fair 45.7% |