Immigrants from Ukraine vs Pakistani College, 1 year or more
COMPARE
Immigrants from Ukraine
Pakistani
College, 1 year or more
College, 1 year or more Comparison
Immigrants from Ukraine
Pakistanis
61.9%
COLLEGE, 1 YEAR OR MORE
95.8/ 100
METRIC RATING
107th/ 347
METRIC RANK
61.5%
COLLEGE, 1 YEAR OR MORE
93.2/ 100
METRIC RATING
120th/ 347
METRIC RANK
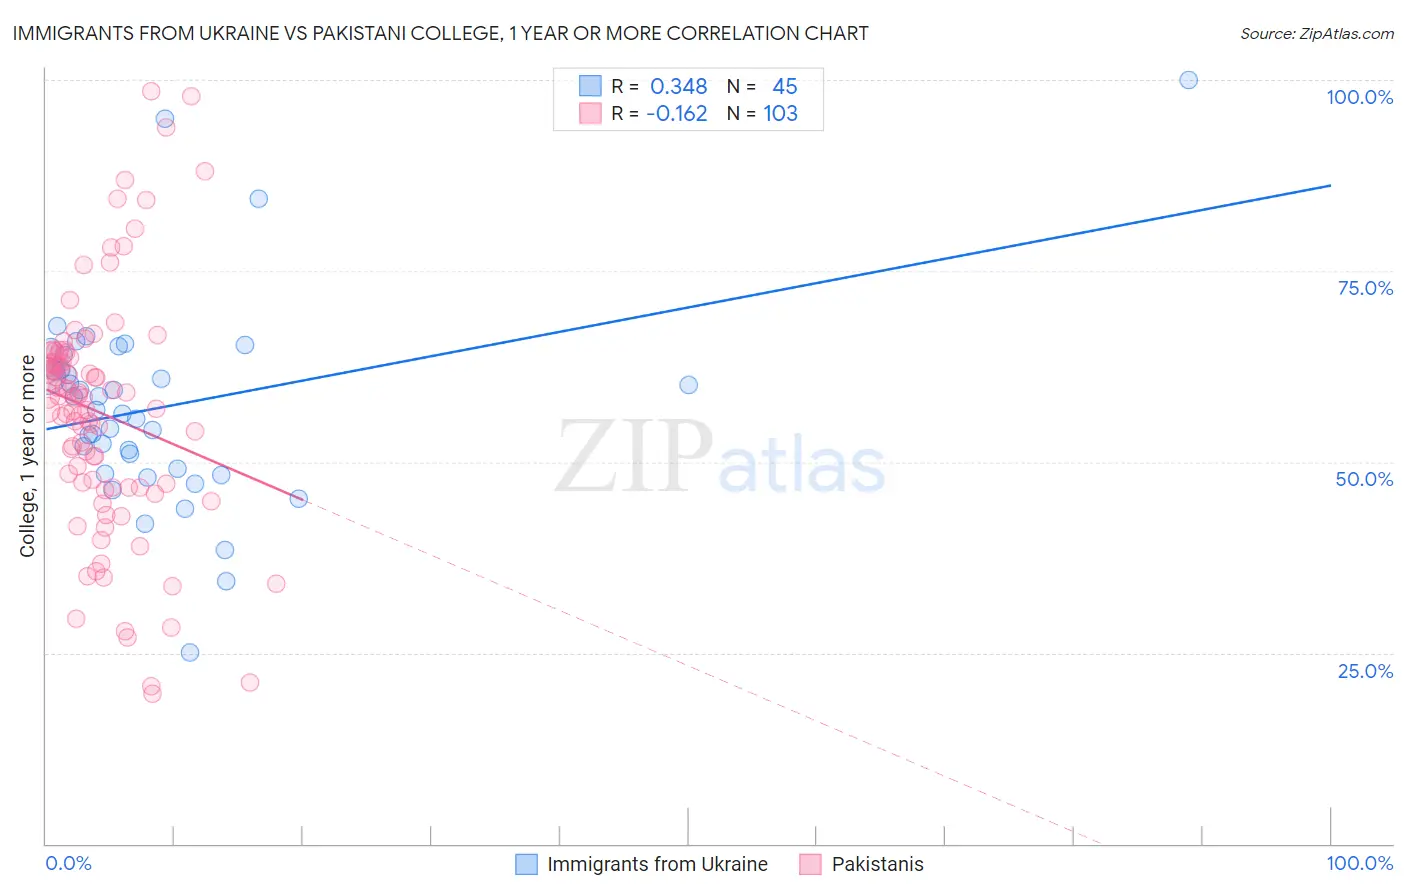
Immigrants from Ukraine vs Pakistani College, 1 year or more Correlation Chart
The statistical analysis conducted on geographies consisting of 289,712,941 people shows a mild positive correlation between the proportion of Immigrants from Ukraine and percentage of population with at least college, 1 year or more education in the United States with a correlation coefficient (R) of 0.348 and weighted average of 61.9%. Similarly, the statistical analysis conducted on geographies consisting of 335,356,650 people shows a poor negative correlation between the proportion of Pakistanis and percentage of population with at least college, 1 year or more education in the United States with a correlation coefficient (R) of -0.162 and weighted average of 61.5%, a difference of 0.64%.
College, 1 year or more Correlation Summary
| Measurement | Immigrants from Ukraine | Pakistani |
| Minimum | 25.0% | 19.6% |
| Maximum | 100.0% | 98.6% |
| Range | 75.0% | 79.0% |
| Mean | 57.2% | 56.5% |
| Median | 56.8% | 58.5% |
| Interquartile 25% (IQ1) | 48.8% | 46.7% |
| Interquartile 75% (IQ3) | 63.0% | 64.1% |
| Interquartile Range (IQR) | 14.2% | 17.4% |
| Standard Deviation (Sample) | 13.4% | 15.7% |
| Standard Deviation (Population) | 13.2% | 15.6% |
Demographics Similar to Immigrants from Ukraine and Pakistanis by College, 1 year or more
In terms of college, 1 year or more, the demographic groups most similar to Immigrants from Ukraine are Syrian (61.9%, a difference of 0.020%), Immigrants from Northern Africa (61.9%, a difference of 0.020%), European (61.8%, a difference of 0.040%), Macedonian (61.8%, a difference of 0.040%), and Austrian (61.8%, a difference of 0.10%). Similarly, the demographic groups most similar to Pakistanis are Assyrian/Chaldean/Syriac (61.5%, a difference of 0.0%), Immigrants from Jordan (61.4%, a difference of 0.10%), Arab (61.6%, a difference of 0.14%), Immigrants from Brazil (61.6%, a difference of 0.14%), and Lebanese (61.6%, a difference of 0.18%).
| Demographics | Rating | Rank | College, 1 year or more |
| Afghans | 96.4 /100 | #103 | Exceptional 62.0% |
| Chileans | 96.4 /100 | #104 | Exceptional 62.0% |
| Immigrants | Nepal | 96.3 /100 | #105 | Exceptional 62.0% |
| Palestinians | 96.3 /100 | #106 | Exceptional 62.0% |
| Immigrants | Ukraine | 95.8 /100 | #107 | Exceptional 61.9% |
| Syrians | 95.7 /100 | #108 | Exceptional 61.9% |
| Immigrants | Northern Africa | 95.7 /100 | #109 | Exceptional 61.9% |
| Europeans | 95.6 /100 | #110 | Exceptional 61.8% |
| Macedonians | 95.6 /100 | #111 | Exceptional 61.8% |
| Austrians | 95.4 /100 | #112 | Exceptional 61.8% |
| Ukrainians | 95.2 /100 | #113 | Exceptional 61.8% |
| Danes | 94.8 /100 | #114 | Exceptional 61.7% |
| Norwegians | 94.5 /100 | #115 | Exceptional 61.7% |
| Lebanese | 94.1 /100 | #116 | Exceptional 61.6% |
| Arabs | 93.9 /100 | #117 | Exceptional 61.6% |
| Immigrants | Brazil | 93.9 /100 | #118 | Exceptional 61.6% |
| Assyrians/Chaldeans/Syriacs | 93.3 /100 | #119 | Exceptional 61.5% |
| Pakistanis | 93.2 /100 | #120 | Exceptional 61.5% |
| Immigrants | Jordan | 92.7 /100 | #121 | Exceptional 61.4% |
| Immigrants | Chile | 92.3 /100 | #122 | Exceptional 61.4% |
| Serbians | 92.2 /100 | #123 | Exceptional 61.4% |