Immigrants from Costa Rica vs Spanish College, 1 year or more
COMPARE
Immigrants from Costa Rica
Spanish
College, 1 year or more
College, 1 year or more Comparison
Immigrants from Costa Rica
Spanish
57.5%
COLLEGE, 1 YEAR OR MORE
8.0/ 100
METRIC RATING
220th/ 347
METRIC RANK
58.5%
COLLEGE, 1 YEAR OR MORE
24.2/ 100
METRIC RATING
200th/ 347
METRIC RANK
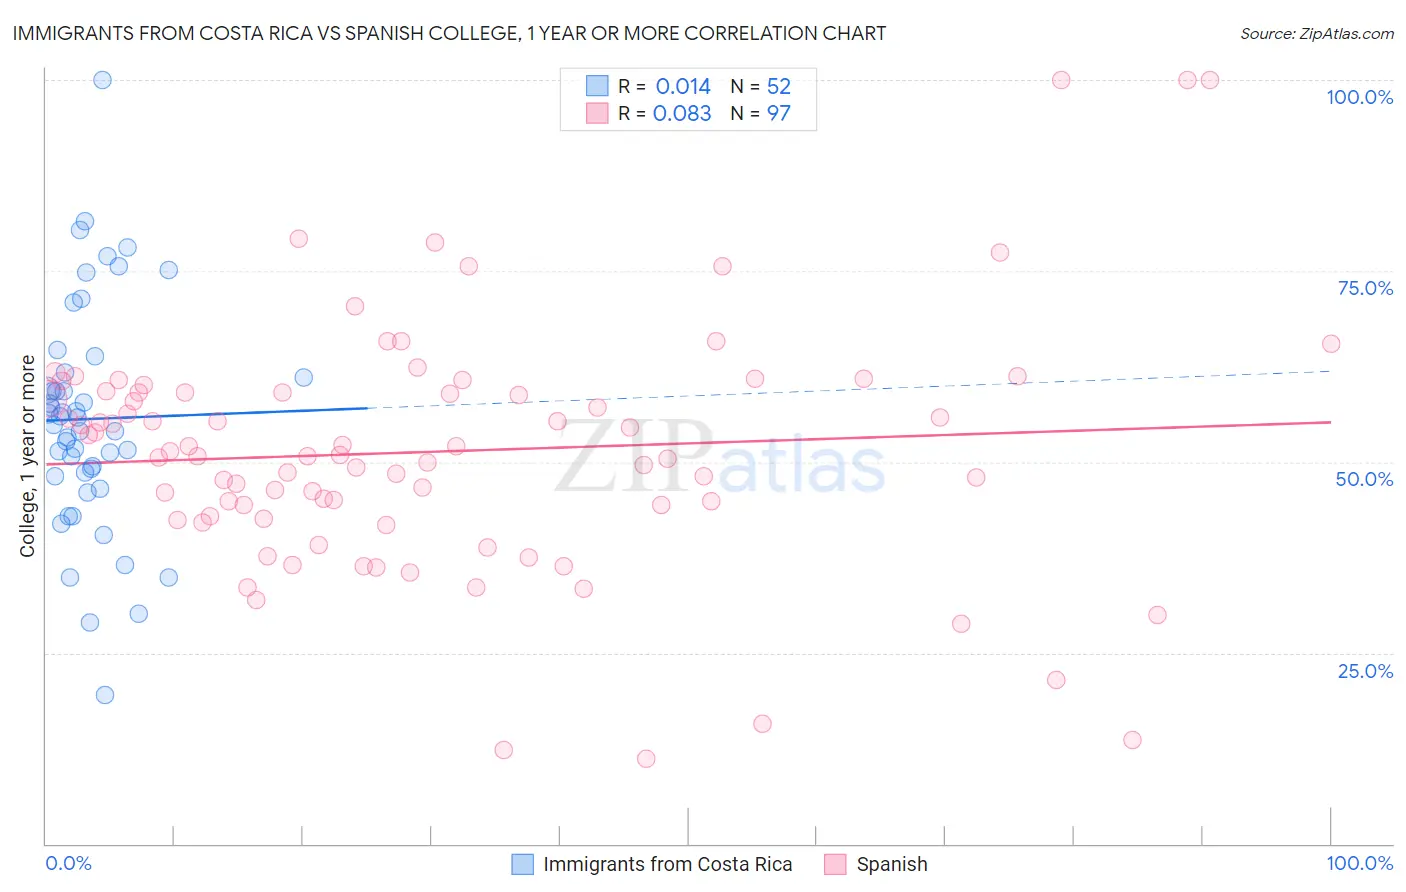
Immigrants from Costa Rica vs Spanish College, 1 year or more Correlation Chart
The statistical analysis conducted on geographies consisting of 204,277,408 people shows no correlation between the proportion of Immigrants from Costa Rica and percentage of population with at least college, 1 year or more education in the United States with a correlation coefficient (R) of 0.014 and weighted average of 57.5%. Similarly, the statistical analysis conducted on geographies consisting of 422,188,641 people shows a slight positive correlation between the proportion of Spanish and percentage of population with at least college, 1 year or more education in the United States with a correlation coefficient (R) of 0.083 and weighted average of 58.5%, a difference of 1.8%.
College, 1 year or more Correlation Summary
| Measurement | Immigrants from Costa Rica | Spanish |
| Minimum | 19.5% | 11.1% |
| Maximum | 100.0% | 100.0% |
| Range | 80.5% | 88.9% |
| Mean | 55.6% | 51.3% |
| Median | 55.4% | 50.8% |
| Interquartile 25% (IQ1) | 48.3% | 42.7% |
| Interquartile 75% (IQ3) | 61.4% | 59.2% |
| Interquartile Range (IQR) | 13.0% | 16.5% |
| Standard Deviation (Sample) | 14.8% | 16.1% |
| Standard Deviation (Population) | 14.7% | 16.1% |
Demographics Similar to Immigrants from Costa Rica and Spanish by College, 1 year or more
In terms of college, 1 year or more, the demographic groups most similar to Immigrants from Costa Rica are White/Caucasian (57.6%, a difference of 0.12%), Native Hawaiian (57.6%, a difference of 0.18%), Immigrants from Panama (57.6%, a difference of 0.19%), Immigrants from Peru (57.7%, a difference of 0.43%), and Immigrants from Colombia (57.8%, a difference of 0.56%). Similarly, the demographic groups most similar to Spanish are Nigerian (58.5%, a difference of 0.090%), Immigrants from South America (58.4%, a difference of 0.17%), Ghanaian (58.4%, a difference of 0.26%), Panamanian (58.3%, a difference of 0.40%), and Immigrants from Zaire (58.3%, a difference of 0.44%).
| Demographics | Rating | Rank | College, 1 year or more |
| Spanish | 24.2 /100 | #200 | Fair 58.5% |
| Nigerians | 23.0 /100 | #201 | Fair 58.5% |
| Immigrants | South America | 21.9 /100 | #202 | Fair 58.4% |
| Ghanaians | 20.9 /100 | #203 | Fair 58.4% |
| Panamanians | 19.2 /100 | #204 | Poor 58.3% |
| Immigrants | Zaire | 18.7 /100 | #205 | Poor 58.3% |
| Immigrants | Vietnam | 18.2 /100 | #206 | Poor 58.2% |
| Senegalese | 16.9 /100 | #207 | Poor 58.2% |
| Immigrants | Uruguay | 15.2 /100 | #208 | Poor 58.1% |
| Immigrants | Middle Africa | 14.0 /100 | #209 | Poor 58.0% |
| Tsimshian | 13.5 /100 | #210 | Poor 57.9% |
| Immigrants | Nigeria | 13.3 /100 | #211 | Poor 57.9% |
| Immigrants | Senegal | 11.8 /100 | #212 | Poor 57.8% |
| French Canadians | 11.8 /100 | #213 | Poor 57.8% |
| Immigrants | Colombia | 11.6 /100 | #214 | Poor 57.8% |
| Tongans | 11.6 /100 | #215 | Poor 57.8% |
| Immigrants | Peru | 10.6 /100 | #216 | Poor 57.7% |
| Immigrants | Panama | 9.1 /100 | #217 | Tragic 57.6% |
| Native Hawaiians | 9.0 /100 | #218 | Tragic 57.6% |
| Whites/Caucasians | 8.7 /100 | #219 | Tragic 57.6% |
| Immigrants | Costa Rica | 8.0 /100 | #220 | Tragic 57.5% |