Immigrants from Turkey vs Portuguese 10th Grade
COMPARE
Immigrants from Turkey
Portuguese
10th Grade
10th Grade Comparison
Immigrants from Turkey
Portuguese
94.5%
10TH GRADE
97.4/ 100
METRIC RATING
105th/ 347
METRIC RANK
93.3%
10TH GRADE
12.1/ 100
METRIC RATING
217th/ 347
METRIC RANK
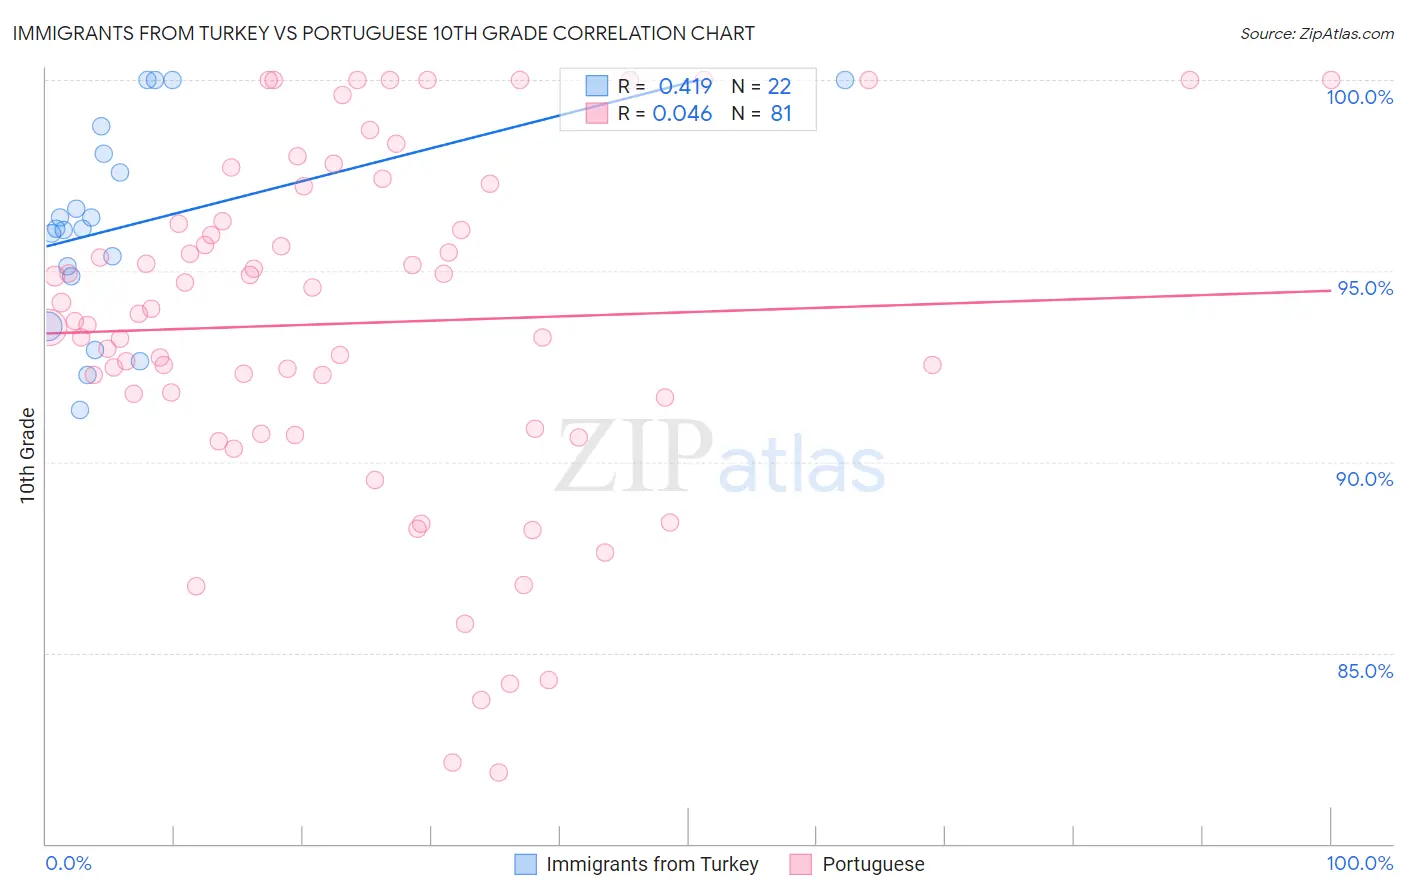
Immigrants from Turkey vs Portuguese 10th Grade Correlation Chart
The statistical analysis conducted on geographies consisting of 223,057,877 people shows a moderate positive correlation between the proportion of Immigrants from Turkey and percentage of population with at least 10th grade education in the United States with a correlation coefficient (R) of 0.419 and weighted average of 94.5%. Similarly, the statistical analysis conducted on geographies consisting of 450,343,001 people shows no correlation between the proportion of Portuguese and percentage of population with at least 10th grade education in the United States with a correlation coefficient (R) of 0.046 and weighted average of 93.3%, a difference of 1.3%.
10th Grade Correlation Summary
| Measurement | Immigrants from Turkey | Portuguese |
| Minimum | 91.4% | 81.9% |
| Maximum | 100.0% | 100.0% |
| Range | 8.6% | 18.1% |
| Mean | 96.2% | 93.6% |
| Median | 96.1% | 93.9% |
| Interquartile 25% (IQ1) | 94.9% | 91.3% |
| Interquartile 75% (IQ3) | 98.1% | 96.8% |
| Interquartile Range (IQR) | 3.2% | 5.5% |
| Standard Deviation (Sample) | 2.6% | 4.5% |
| Standard Deviation (Population) | 2.6% | 4.5% |
Similar Demographics by 10th Grade
Demographics Similar to Immigrants from Turkey by 10th Grade
In terms of 10th grade, the demographic groups most similar to Immigrants from Turkey are Immigrants from Romania (94.5%, a difference of 0.0%), Immigrants from Serbia (94.5%, a difference of 0.0%), Immigrants from Croatia (94.5%, a difference of 0.0%), Immigrants from Europe (94.5%, a difference of 0.010%), and Cambodian (94.5%, a difference of 0.020%).
| Demographics | Rating | Rank | 10th Grade |
| Immigrants | Bulgaria | 98.1 /100 | #98 | Exceptional 94.6% |
| Immigrants | France | 97.9 /100 | #99 | Exceptional 94.5% |
| Immigrants | South Central Asia | 97.8 /100 | #100 | Exceptional 94.5% |
| Syrians | 97.7 /100 | #101 | Exceptional 94.5% |
| Cambodians | 97.6 /100 | #102 | Exceptional 94.5% |
| Immigrants | Europe | 97.5 /100 | #103 | Exceptional 94.5% |
| Immigrants | Romania | 97.5 /100 | #104 | Exceptional 94.5% |
| Immigrants | Turkey | 97.4 /100 | #105 | Exceptional 94.5% |
| Immigrants | Serbia | 97.4 /100 | #106 | Exceptional 94.5% |
| Immigrants | Croatia | 97.4 /100 | #107 | Exceptional 94.5% |
| Immigrants | North Macedonia | 97.2 /100 | #108 | Exceptional 94.5% |
| Immigrants | Norway | 97.2 /100 | #109 | Exceptional 94.5% |
| Burmese | 97.1 /100 | #110 | Exceptional 94.5% |
| Immigrants | Zimbabwe | 96.8 /100 | #111 | Exceptional 94.4% |
| Immigrants | Kuwait | 96.8 /100 | #112 | Exceptional 94.4% |
Demographics Similar to Portuguese by 10th Grade
In terms of 10th grade, the demographic groups most similar to Portuguese are Immigrants from Liberia (93.3%, a difference of 0.040%), Seminole (93.3%, a difference of 0.040%), Immigrants from Eastern Africa (93.4%, a difference of 0.050%), Immigrants from Bahamas (93.4%, a difference of 0.060%), and Immigrants from Oceania (93.4%, a difference of 0.060%).
| Demographics | Rating | Rank | 10th Grade |
| Indians (Asian) | 17.6 /100 | #210 | Poor 93.4% |
| Cajuns | 16.9 /100 | #211 | Poor 93.4% |
| Immigrants | Zaire | 16.7 /100 | #212 | Poor 93.4% |
| Immigrants | Asia | 15.7 /100 | #213 | Poor 93.4% |
| Immigrants | Bahamas | 15.2 /100 | #214 | Poor 93.4% |
| Immigrants | Oceania | 15.1 /100 | #215 | Poor 93.4% |
| Immigrants | Eastern Africa | 14.7 /100 | #216 | Poor 93.4% |
| Portuguese | 12.1 /100 | #217 | Poor 93.3% |
| Immigrants | Liberia | 10.2 /100 | #218 | Poor 93.3% |
| Seminole | 10.2 /100 | #219 | Poor 93.3% |
| Tongans | 9.5 /100 | #220 | Tragic 93.3% |
| Immigrants | Southern Europe | 8.9 /100 | #221 | Tragic 93.2% |
| Ethiopians | 7.9 /100 | #222 | Tragic 93.2% |
| Immigrants | Sierra Leone | 7.6 /100 | #223 | Tragic 93.2% |
| Bolivians | 6.7 /100 | #224 | Tragic 93.2% |