Immigrants from Taiwan vs Czechoslovakian Associate's Degree
COMPARE
Immigrants from Taiwan
Czechoslovakian
Associate's Degree
Associate's Degree Comparison
Immigrants from Taiwan
Czechoslovakians
58.4%
ASSOCIATE'S DEGREE
100.0/ 100
METRIC RATING
4th/ 347
METRIC RANK
46.0%
ASSOCIATE'S DEGREE
40.0/ 100
METRIC RATING
184th/ 347
METRIC RANK
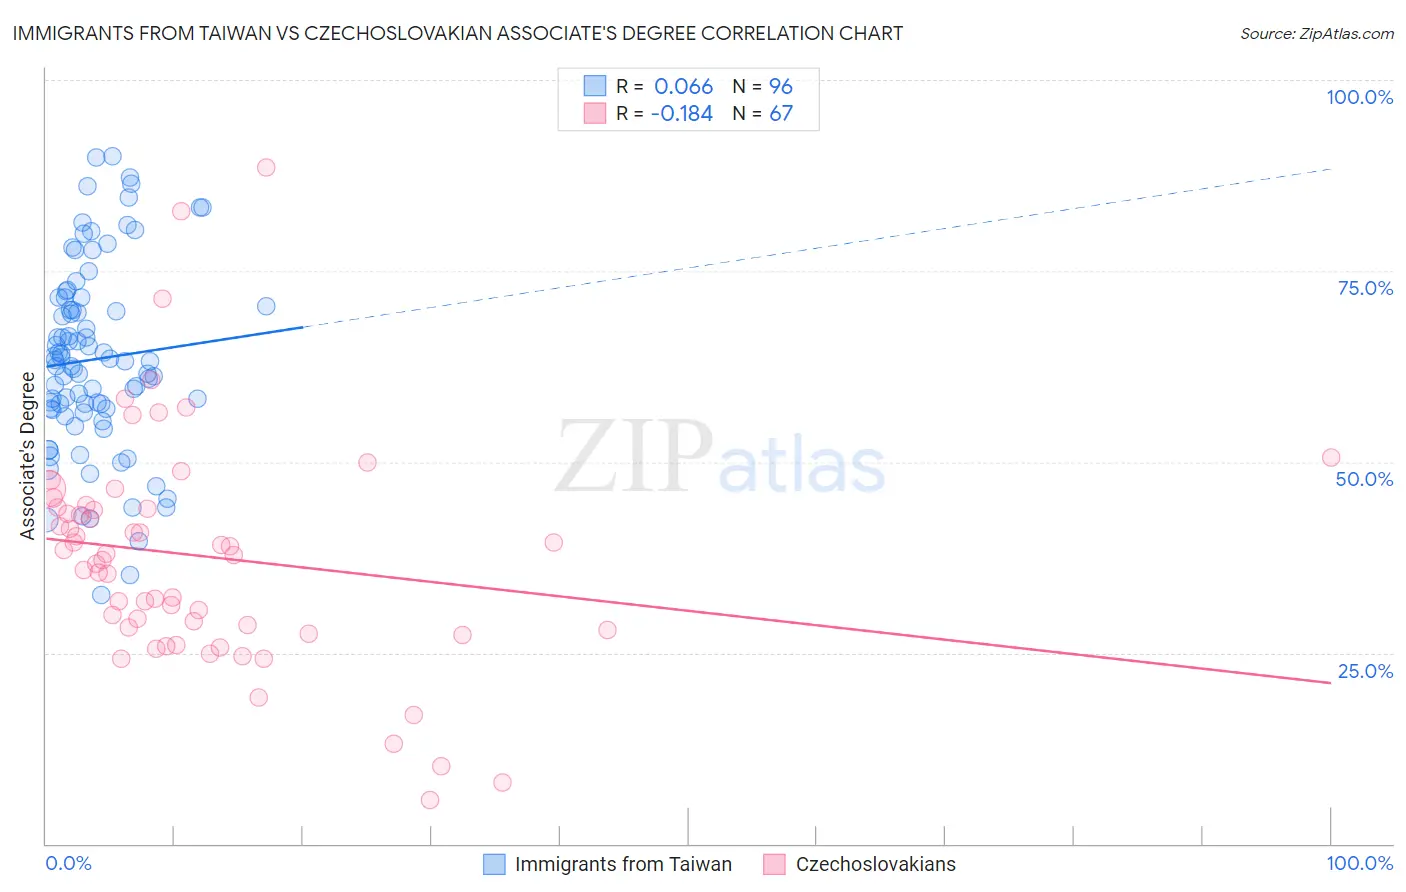
Immigrants from Taiwan vs Czechoslovakian Associate's Degree Correlation Chart
The statistical analysis conducted on geographies consisting of 298,276,858 people shows a slight positive correlation between the proportion of Immigrants from Taiwan and percentage of population with at least associate's degree education in the United States with a correlation coefficient (R) of 0.066 and weighted average of 58.4%. Similarly, the statistical analysis conducted on geographies consisting of 368,660,591 people shows a poor negative correlation between the proportion of Czechoslovakians and percentage of population with at least associate's degree education in the United States with a correlation coefficient (R) of -0.184 and weighted average of 46.0%, a difference of 27.0%.
Associate's Degree Correlation Summary
| Measurement | Immigrants from Taiwan | Czechoslovakian |
| Minimum | 32.5% | 5.7% |
| Maximum | 89.9% | 88.6% |
| Range | 57.4% | 82.8% |
| Mean | 63.4% | 37.6% |
| Median | 63.2% | 37.8% |
| Interquartile 25% (IQ1) | 56.9% | 28.0% |
| Interquartile 75% (IQ3) | 70.9% | 44.1% |
| Interquartile Range (IQR) | 14.0% | 16.1% |
| Standard Deviation (Sample) | 12.4% | 15.1% |
| Standard Deviation (Population) | 12.4% | 15.0% |
Similar Demographics by Associate's Degree
Demographics Similar to Immigrants from Taiwan by Associate's Degree
In terms of associate's degree, the demographic groups most similar to Immigrants from Taiwan are Immigrants from India (58.5%, a difference of 0.25%), Iranian (58.2%, a difference of 0.41%), Immigrants from Singapore (58.9%, a difference of 0.91%), Okinawan (57.7%, a difference of 1.2%), and Immigrants from Iran (57.7%, a difference of 1.3%).
| Demographics | Rating | Rank | Associate's Degree |
| Filipinos | 100.0 /100 | #1 | Exceptional 59.8% |
| Immigrants | Singapore | 100.0 /100 | #2 | Exceptional 58.9% |
| Immigrants | India | 100.0 /100 | #3 | Exceptional 58.5% |
| Immigrants | Taiwan | 100.0 /100 | #4 | Exceptional 58.4% |
| Iranians | 100.0 /100 | #5 | Exceptional 58.2% |
| Okinawans | 100.0 /100 | #6 | Exceptional 57.7% |
| Immigrants | Iran | 100.0 /100 | #7 | Exceptional 57.7% |
| Thais | 100.0 /100 | #8 | Exceptional 57.4% |
| Immigrants | Israel | 100.0 /100 | #9 | Exceptional 56.8% |
| Cypriots | 100.0 /100 | #10 | Exceptional 56.4% |
| Immigrants | Australia | 100.0 /100 | #11 | Exceptional 55.8% |
| Immigrants | South Central Asia | 100.0 /100 | #12 | Exceptional 55.7% |
| Immigrants | China | 100.0 /100 | #13 | Exceptional 55.5% |
| Immigrants | Hong Kong | 100.0 /100 | #14 | Exceptional 55.4% |
| Immigrants | Eastern Asia | 100.0 /100 | #15 | Exceptional 55.4% |
Demographics Similar to Czechoslovakians by Associate's Degree
In terms of associate's degree, the demographic groups most similar to Czechoslovakians are Yugoslavian (46.0%, a difference of 0.020%), Swiss (46.0%, a difference of 0.030%), Immigrants from Colombia (46.0%, a difference of 0.10%), Costa Rican (46.0%, a difference of 0.11%), and Welsh (45.9%, a difference of 0.17%).
| Demographics | Rating | Rank | Associate's Degree |
| Slovaks | 48.4 /100 | #177 | Average 46.3% |
| Immigrants | Bosnia and Herzegovina | 48.3 /100 | #178 | Average 46.3% |
| Sri Lankans | 47.6 /100 | #179 | Average 46.3% |
| Bermudans | 46.4 /100 | #180 | Average 46.2% |
| Immigrants | Colombia | 41.3 /100 | #181 | Average 46.0% |
| Swiss | 40.4 /100 | #182 | Average 46.0% |
| Yugoslavians | 40.2 /100 | #183 | Average 46.0% |
| Czechoslovakians | 40.0 /100 | #184 | Average 46.0% |
| Costa Ricans | 38.6 /100 | #185 | Fair 46.0% |
| Welsh | 37.9 /100 | #186 | Fair 45.9% |
| Immigrants | Uruguay | 35.5 /100 | #187 | Fair 45.8% |
| Ghanaians | 35.5 /100 | #188 | Fair 45.8% |
| Immigrants | Oceania | 34.7 /100 | #189 | Fair 45.8% |
| Vietnamese | 34.0 /100 | #190 | Fair 45.8% |
| Koreans | 33.8 /100 | #191 | Fair 45.8% |