Immigrants from Syria vs Immigrants from Chile Master's Degree
COMPARE
Immigrants from Syria
Immigrants from Chile
Master's Degree
Master's Degree Comparison
Immigrants from Syria
Immigrants from Chile
16.2%
MASTER'S DEGREE
93.3/ 100
METRIC RATING
129th/ 347
METRIC RANK
16.8%
MASTER'S DEGREE
98.0/ 100
METRIC RATING
110th/ 347
METRIC RANK
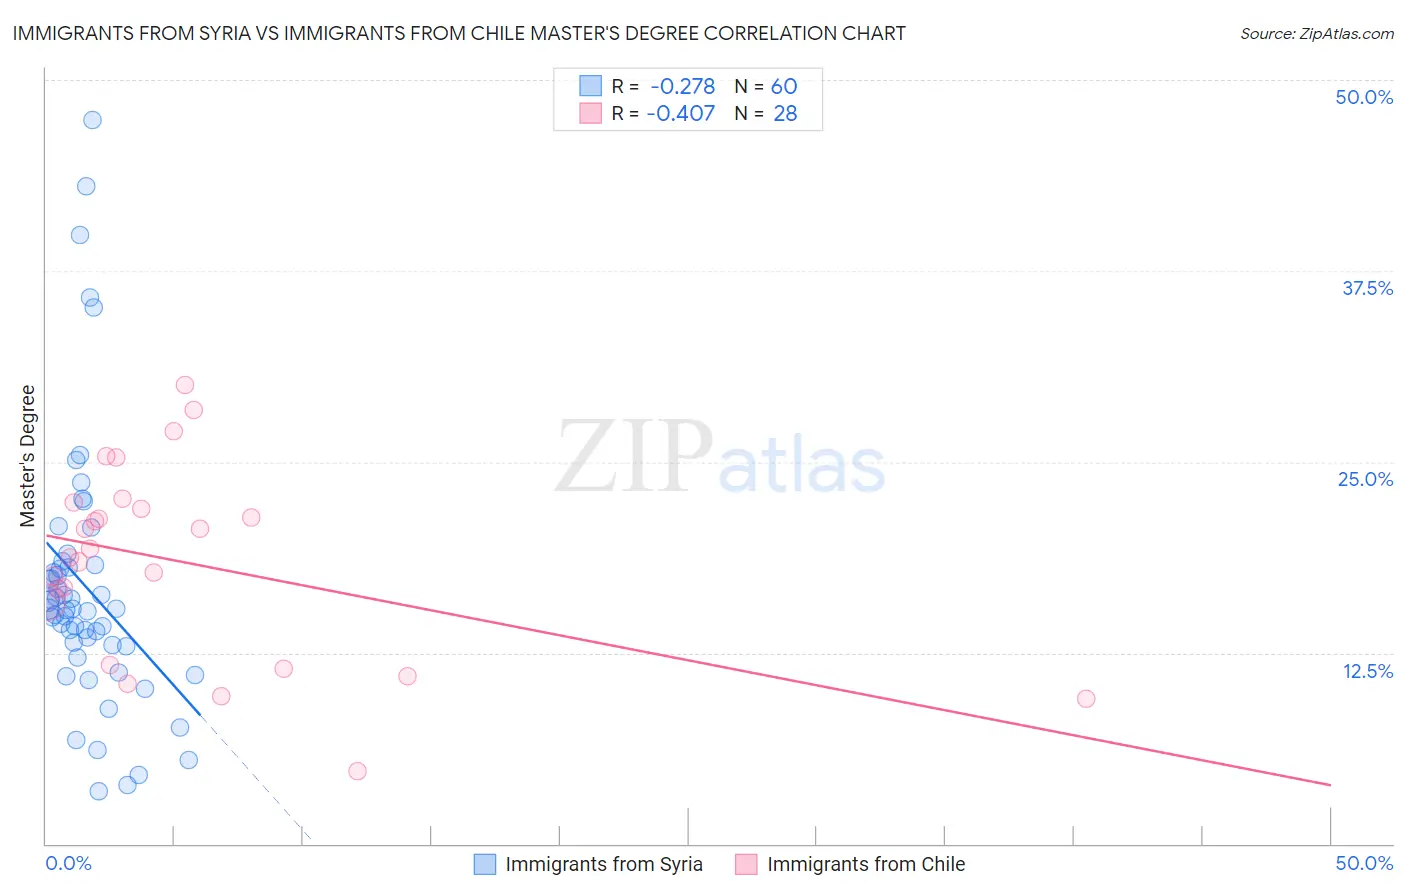
Immigrants from Syria vs Immigrants from Chile Master's Degree Correlation Chart
The statistical analysis conducted on geographies consisting of 174,107,928 people shows a weak negative correlation between the proportion of Immigrants from Syria and percentage of population with at least master's degree education in the United States with a correlation coefficient (R) of -0.278 and weighted average of 16.2%. Similarly, the statistical analysis conducted on geographies consisting of 218,626,244 people shows a moderate negative correlation between the proportion of Immigrants from Chile and percentage of population with at least master's degree education in the United States with a correlation coefficient (R) of -0.407 and weighted average of 16.8%, a difference of 3.7%.
Master's Degree Correlation Summary
| Measurement | Immigrants from Syria | Immigrants from Chile |
| Minimum | 3.4% | 4.8% |
| Maximum | 47.4% | 30.0% |
| Range | 44.0% | 25.2% |
| Mean | 16.8% | 18.5% |
| Median | 15.3% | 19.0% |
| Interquartile 25% (IQ1) | 13.0% | 13.8% |
| Interquartile 75% (IQ3) | 18.2% | 22.1% |
| Interquartile Range (IQR) | 5.2% | 8.3% |
| Standard Deviation (Sample) | 8.7% | 6.2% |
| Standard Deviation (Population) | 8.6% | 6.1% |
Demographics Similar to Immigrants from Syria and Immigrants from Chile by Master's Degree
In terms of master's degree, the demographic groups most similar to Immigrants from Syria are Immigrants from Sierra Leone (16.3%, a difference of 0.75%), Palestinian (16.3%, a difference of 0.80%), Immigrants from Eastern Africa (16.3%, a difference of 1.1%), Italian (16.4%, a difference of 1.2%), and Immigrants from Eritrea (16.4%, a difference of 1.3%). Similarly, the demographic groups most similar to Immigrants from Chile are Moroccan (16.8%, a difference of 0.030%), Austrian (16.7%, a difference of 0.27%), Macedonian (16.7%, a difference of 0.41%), Arab (16.7%, a difference of 0.42%), and Northern European (16.7%, a difference of 0.49%).
| Demographics | Rating | Rank | Master's Degree |
| Moroccans | 98.0 /100 | #109 | Exceptional 16.8% |
| Immigrants | Chile | 98.0 /100 | #110 | Exceptional 16.8% |
| Austrians | 97.8 /100 | #111 | Exceptional 16.7% |
| Macedonians | 97.7 /100 | #112 | Exceptional 16.7% |
| Arabs | 97.7 /100 | #113 | Exceptional 16.7% |
| Northern Europeans | 97.6 /100 | #114 | Exceptional 16.7% |
| Immigrants | Uganda | 97.3 /100 | #115 | Exceptional 16.6% |
| Immigrants | Southern Europe | 97.2 /100 | #116 | Exceptional 16.6% |
| Immigrants | Moldova | 97.2 /100 | #117 | Exceptional 16.6% |
| Brazilians | 96.8 /100 | #118 | Exceptional 16.5% |
| Jordanians | 96.5 /100 | #119 | Exceptional 16.5% |
| Lebanese | 96.4 /100 | #120 | Exceptional 16.5% |
| Afghans | 96.2 /100 | #121 | Exceptional 16.5% |
| British | 95.6 /100 | #122 | Exceptional 16.4% |
| Croatians | 95.6 /100 | #123 | Exceptional 16.4% |
| Immigrants | Eritrea | 95.5 /100 | #124 | Exceptional 16.4% |
| Italians | 95.4 /100 | #125 | Exceptional 16.4% |
| Immigrants | Eastern Africa | 95.2 /100 | #126 | Exceptional 16.3% |
| Palestinians | 94.8 /100 | #127 | Exceptional 16.3% |
| Immigrants | Sierra Leone | 94.7 /100 | #128 | Exceptional 16.3% |
| Immigrants | Syria | 93.3 /100 | #129 | Exceptional 16.2% |