Immigrants from Sweden vs Chilean 7th Grade
COMPARE
Immigrants from Sweden
Chilean
7th Grade
7th Grade Comparison
Immigrants from Sweden
Chileans
96.7%
7TH GRADE
98.7/ 100
METRIC RATING
98th/ 347
METRIC RANK
96.0%
7TH GRADE
49.3/ 100
METRIC RATING
176th/ 347
METRIC RANK
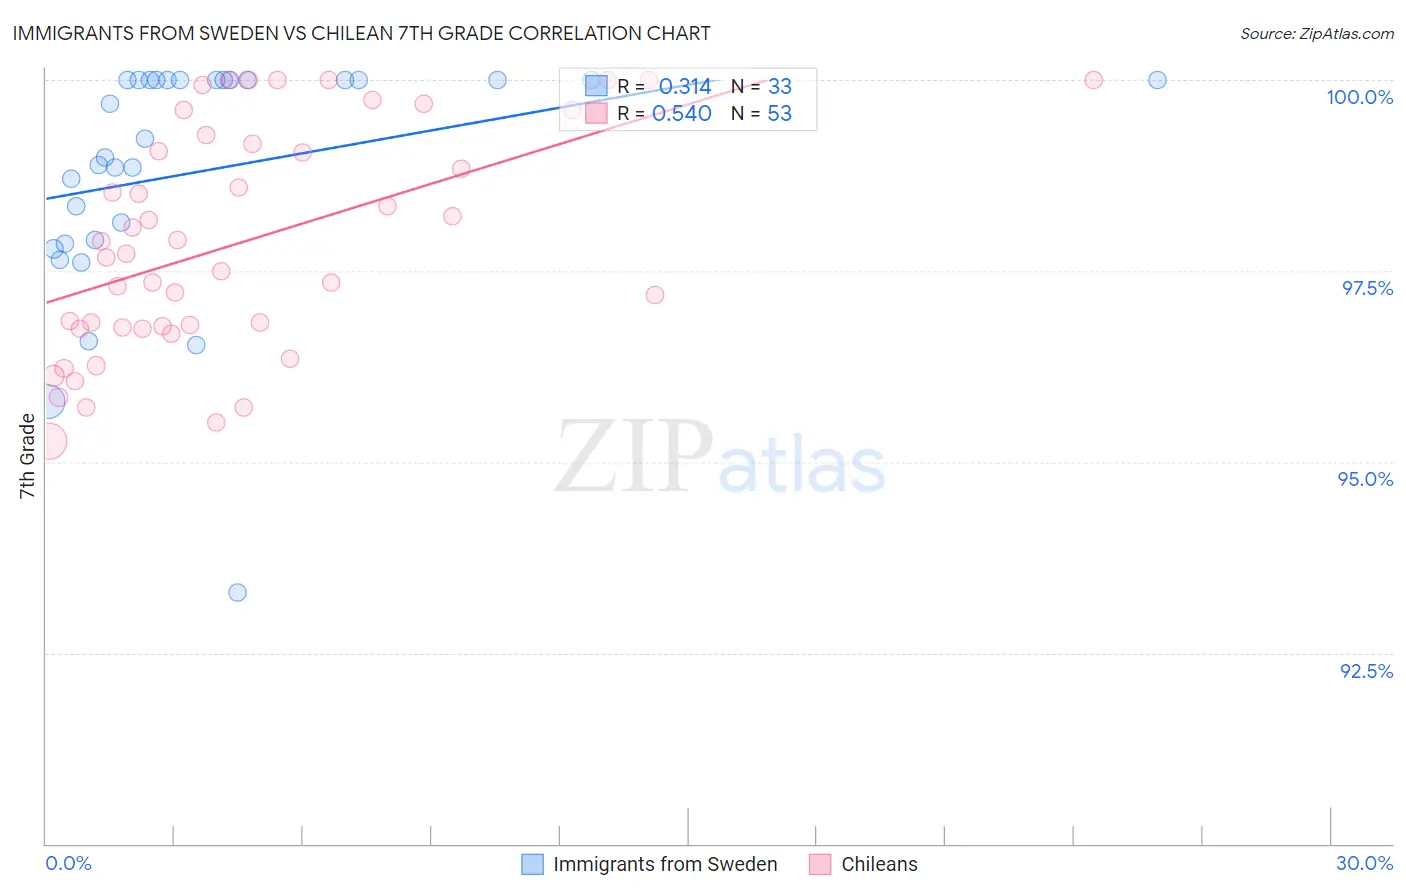
Immigrants from Sweden vs Chilean 7th Grade Correlation Chart
The statistical analysis conducted on geographies consisting of 164,737,275 people shows a mild positive correlation between the proportion of Immigrants from Sweden and percentage of population with at least 7th grade education in the United States with a correlation coefficient (R) of 0.314 and weighted average of 96.7%. Similarly, the statistical analysis conducted on geographies consisting of 256,681,007 people shows a substantial positive correlation between the proportion of Chileans and percentage of population with at least 7th grade education in the United States with a correlation coefficient (R) of 0.540 and weighted average of 96.0%, a difference of 0.66%.
7th Grade Correlation Summary
| Measurement | Immigrants from Sweden | Chilean |
| Minimum | 93.3% | 95.3% |
| Maximum | 100.0% | 100.0% |
| Range | 6.7% | 4.7% |
| Mean | 98.8% | 97.9% |
| Median | 99.2% | 97.7% |
| Interquartile 25% (IQ1) | 97.9% | 96.8% |
| Interquartile 75% (IQ3) | 100.0% | 99.2% |
| Interquartile Range (IQR) | 2.1% | 2.5% |
| Standard Deviation (Sample) | 1.6% | 1.5% |
| Standard Deviation (Population) | 1.5% | 1.4% |
Similar Demographics by 7th Grade
Demographics Similar to Immigrants from Sweden by 7th Grade
In terms of 7th grade, the demographic groups most similar to Immigrants from Sweden are Immigrants from Denmark (96.7%, a difference of 0.0%), Immigrants from Germany (96.7%, a difference of 0.0%), Menominee (96.7%, a difference of 0.0%), Immigrants from Australia (96.7%, a difference of 0.010%), and German Russian (96.7%, a difference of 0.010%).
| Demographics | Rating | Rank | 7th Grade |
| Osage | 98.9 /100 | #91 | Exceptional 96.7% |
| Immigrants | Western Europe | 98.9 /100 | #92 | Exceptional 96.7% |
| Potawatomi | 98.9 /100 | #93 | Exceptional 96.7% |
| Lebanese | 98.8 /100 | #94 | Exceptional 96.7% |
| Immigrants | Australia | 98.8 /100 | #95 | Exceptional 96.7% |
| Immigrants | Denmark | 98.7 /100 | #96 | Exceptional 96.7% |
| Immigrants | Germany | 98.7 /100 | #97 | Exceptional 96.7% |
| Immigrants | Sweden | 98.7 /100 | #98 | Exceptional 96.7% |
| Menominee | 98.7 /100 | #99 | Exceptional 96.7% |
| German Russians | 98.6 /100 | #100 | Exceptional 96.7% |
| Thais | 98.6 /100 | #101 | Exceptional 96.7% |
| Immigrants | Czechoslovakia | 98.3 /100 | #102 | Exceptional 96.6% |
| Immigrants | Singapore | 98.3 /100 | #103 | Exceptional 96.6% |
| Shoshone | 98.1 /100 | #104 | Exceptional 96.6% |
| South Africans | 98.0 /100 | #105 | Exceptional 96.6% |
Demographics Similar to Chileans by 7th Grade
In terms of 7th grade, the demographic groups most similar to Chileans are Mongolian (96.0%, a difference of 0.0%), Black/African American (96.0%, a difference of 0.0%), Immigrants from Korea (96.0%, a difference of 0.0%), Venezuelan (96.0%, a difference of 0.010%), and Immigrants from Albania (96.0%, a difference of 0.010%).
| Demographics | Rating | Rank | 7th Grade |
| Ute | 55.8 /100 | #169 | Average 96.1% |
| Immigrants | Ukraine | 55.0 /100 | #170 | Average 96.1% |
| Egyptians | 54.2 /100 | #171 | Average 96.1% |
| Venezuelans | 51.4 /100 | #172 | Average 96.0% |
| Immigrants | Albania | 50.4 /100 | #173 | Average 96.0% |
| Mongolians | 50.0 /100 | #174 | Average 96.0% |
| Blacks/African Americans | 49.5 /100 | #175 | Average 96.0% |
| Chileans | 49.3 /100 | #176 | Average 96.0% |
| Immigrants | Korea | 49.2 /100 | #177 | Average 96.0% |
| Marshallese | 48.4 /100 | #178 | Average 96.0% |
| Immigrants | Iran | 47.8 /100 | #179 | Average 96.0% |
| Immigrants | Brazil | 46.8 /100 | #180 | Average 96.0% |
| Pakistanis | 44.5 /100 | #181 | Average 96.0% |
| Iraqis | 41.2 /100 | #182 | Average 96.0% |
| Immigrants | Spain | 38.8 /100 | #183 | Fair 96.0% |