Immigrants from Sweden vs Scandinavian Unemployment
COMPARE
Immigrants from Sweden
Scandinavian
Unemployment
Unemployment Comparison
Immigrants from Sweden
Scandinavians
5.0%
UNEMPLOYMENT
97.6/ 100
METRIC RATING
80th/ 347
METRIC RANK
4.5%
UNEMPLOYMENT
100.0/ 100
METRIC RATING
9th/ 347
METRIC RANK
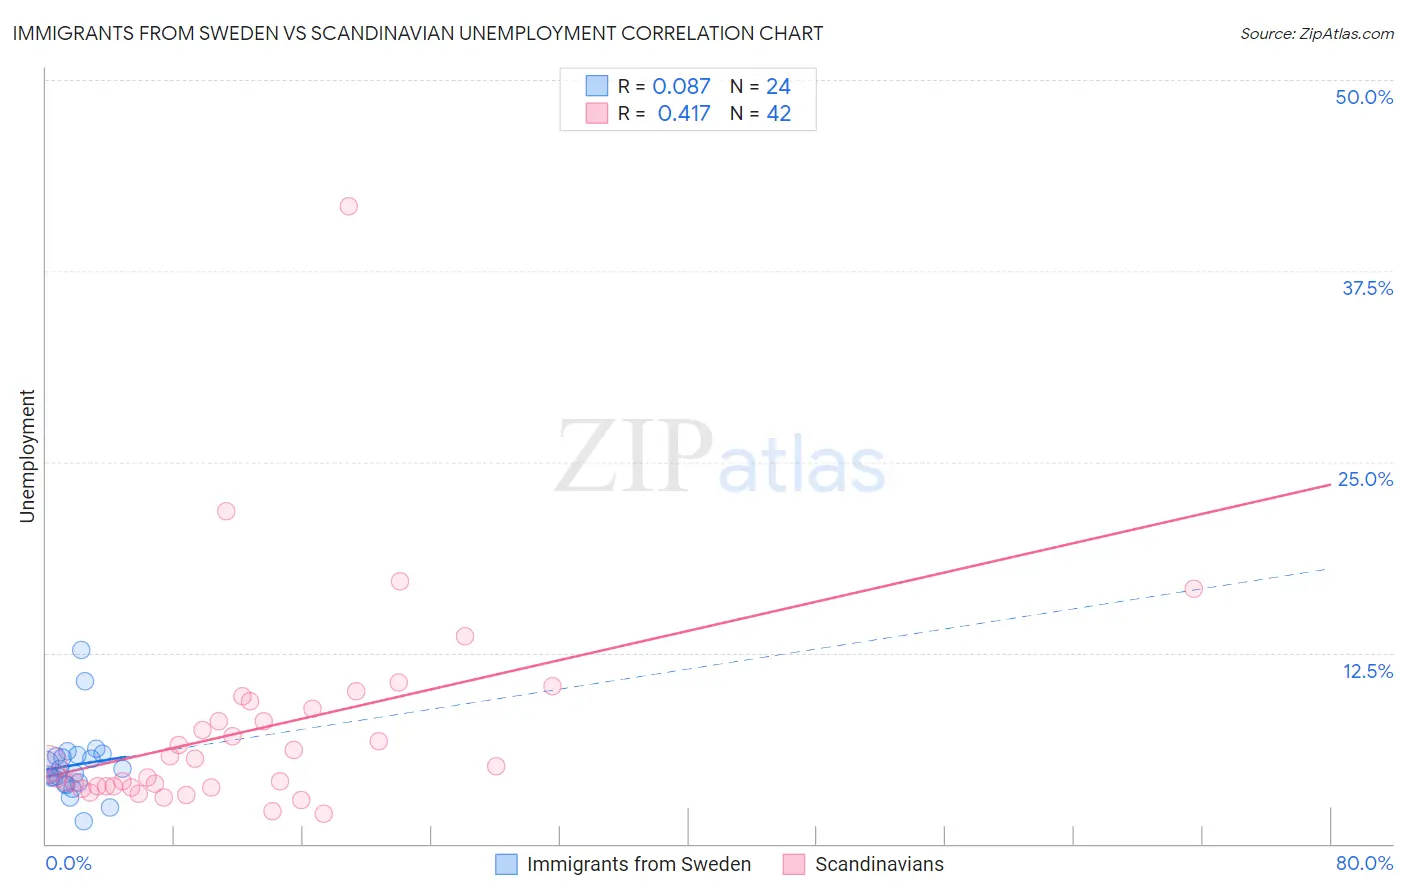
Immigrants from Sweden vs Scandinavian Unemployment Correlation Chart
The statistical analysis conducted on geographies consisting of 164,697,835 people shows a slight positive correlation between the proportion of Immigrants from Sweden and unemployment in the United States with a correlation coefficient (R) of 0.087 and weighted average of 5.0%. Similarly, the statistical analysis conducted on geographies consisting of 471,134,185 people shows a moderate positive correlation between the proportion of Scandinavians and unemployment in the United States with a correlation coefficient (R) of 0.417 and weighted average of 4.5%, a difference of 9.0%.
Unemployment Correlation Summary
| Measurement | Immigrants from Sweden | Scandinavian |
| Minimum | 1.5% | 2.0% |
| Maximum | 12.7% | 41.7% |
| Range | 11.2% | 39.7% |
| Mean | 5.2% | 7.4% |
| Median | 4.7% | 5.2% |
| Interquartile 25% (IQ1) | 4.0% | 3.7% |
| Interquartile 75% (IQ3) | 5.8% | 8.8% |
| Interquartile Range (IQR) | 1.8% | 5.1% |
| Standard Deviation (Sample) | 2.3% | 6.9% |
| Standard Deviation (Population) | 2.3% | 6.8% |
Similar Demographics by Unemployment
Demographics Similar to Immigrants from Sweden by Unemployment
In terms of unemployment, the demographic groups most similar to Immigrants from Sweden are Basque (5.0%, a difference of 0.010%), Fijian (5.0%, a difference of 0.020%), Hmong (5.0%, a difference of 0.030%), Canadian (5.0%, a difference of 0.070%), and Russian (5.0%, a difference of 0.11%).
| Demographics | Rating | Rank | Unemployment |
| Paraguayans | 98.3 /100 | #73 | Exceptional 4.9% |
| Immigrants | Northern Europe | 98.2 /100 | #74 | Exceptional 4.9% |
| Turks | 98.0 /100 | #75 | Exceptional 4.9% |
| German Russians | 98.0 /100 | #76 | Exceptional 4.9% |
| Cypriots | 97.9 /100 | #77 | Exceptional 4.9% |
| Okinawans | 97.9 /100 | #78 | Exceptional 4.9% |
| Canadians | 97.7 /100 | #79 | Exceptional 5.0% |
| Immigrants | Sweden | 97.6 /100 | #80 | Exceptional 5.0% |
| Basques | 97.6 /100 | #81 | Exceptional 5.0% |
| Fijians | 97.6 /100 | #82 | Exceptional 5.0% |
| Hmong | 97.6 /100 | #83 | Exceptional 5.0% |
| Russians | 97.4 /100 | #84 | Exceptional 5.0% |
| Immigrants | Australia | 97.0 /100 | #85 | Exceptional 5.0% |
| Hungarians | 96.9 /100 | #86 | Exceptional 5.0% |
| Immigrants | Moldova | 96.6 /100 | #87 | Exceptional 5.0% |
Demographics Similar to Scandinavians by Unemployment
In terms of unemployment, the demographic groups most similar to Scandinavians are Swiss (4.5%, a difference of 0.39%), Dutch (4.6%, a difference of 0.51%), Immigrants from India (4.5%, a difference of 0.86%), English (4.6%, a difference of 1.2%), and Pennsylvania German (4.6%, a difference of 1.3%).
| Demographics | Rating | Rank | Unemployment |
| Luxembourgers | 100.0 /100 | #2 | Exceptional 4.3% |
| Czechs | 100.0 /100 | #3 | Exceptional 4.3% |
| Danes | 100.0 /100 | #4 | Exceptional 4.3% |
| Swedes | 100.0 /100 | #5 | Exceptional 4.4% |
| Germans | 100.0 /100 | #6 | Exceptional 4.5% |
| Immigrants | India | 100.0 /100 | #7 | Exceptional 4.5% |
| Swiss | 100.0 /100 | #8 | Exceptional 4.5% |
| Scandinavians | 100.0 /100 | #9 | Exceptional 4.5% |
| Dutch | 100.0 /100 | #10 | Exceptional 4.6% |
| English | 100.0 /100 | #11 | Exceptional 4.6% |
| Pennsylvania Germans | 100.0 /100 | #12 | Exceptional 4.6% |
| Belgians | 100.0 /100 | #13 | Exceptional 4.6% |
| Immigrants | Cuba | 100.0 /100 | #14 | Exceptional 4.6% |
| Europeans | 99.9 /100 | #15 | Exceptional 4.6% |
| Chinese | 99.9 /100 | #16 | Exceptional 4.7% |