Immigrants from Sweden vs English 3rd Grade
COMPARE
Immigrants from Sweden
English
3rd Grade
3rd Grade Comparison
Immigrants from Sweden
English
98.1%
3RD GRADE
98.9/ 100
METRIC RATING
84th/ 347
METRIC RANK
98.6%
3RD GRADE
100.0/ 100
METRIC RATING
12th/ 347
METRIC RANK
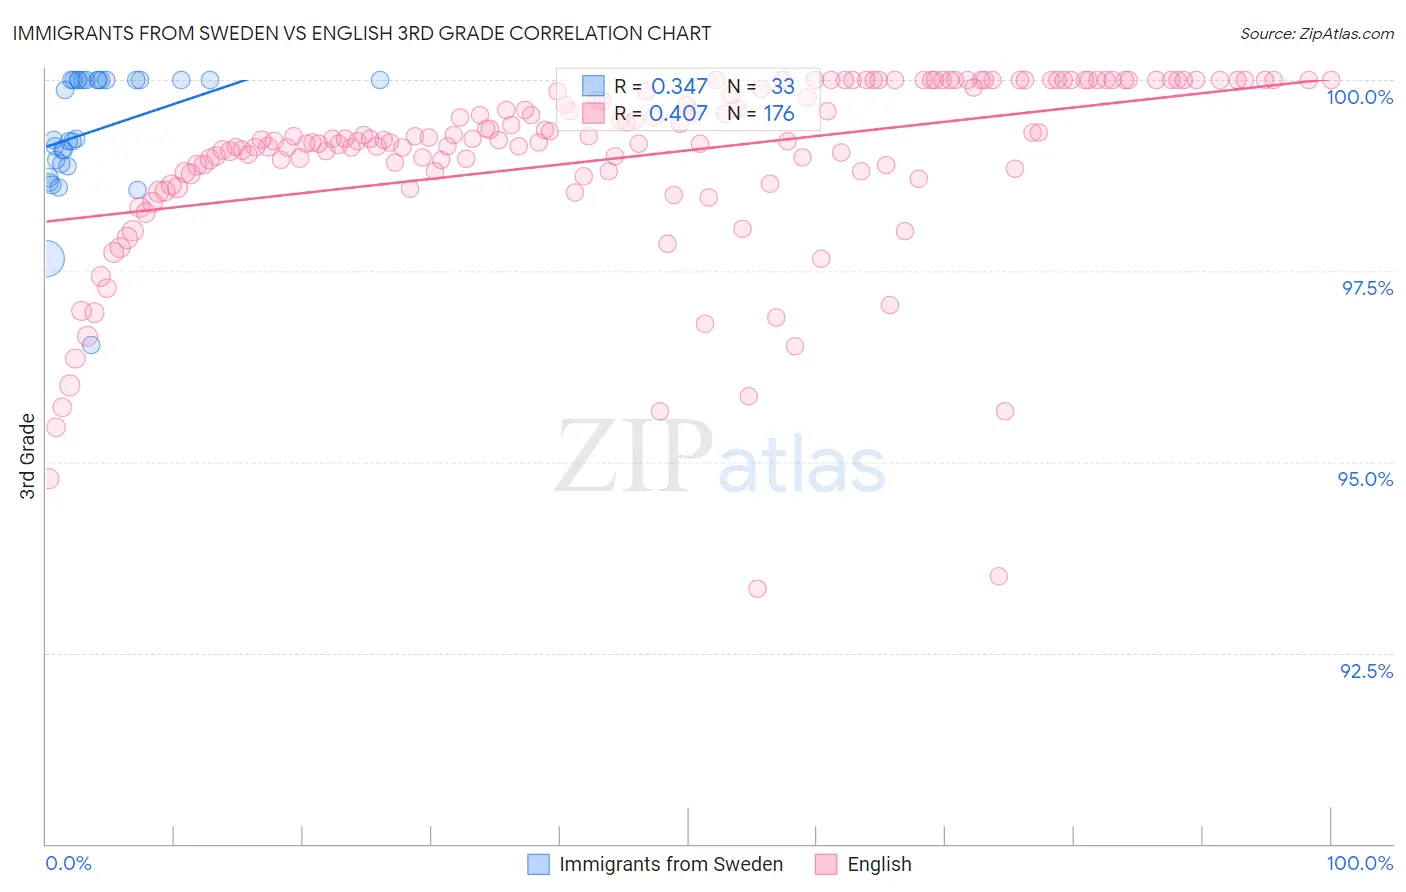
Immigrants from Sweden vs English 3rd Grade Correlation Chart
The statistical analysis conducted on geographies consisting of 164,737,092 people shows a mild positive correlation between the proportion of Immigrants from Sweden and percentage of population with at least 3rd grade education in the United States with a correlation coefficient (R) of 0.347 and weighted average of 98.1%. Similarly, the statistical analysis conducted on geographies consisting of 579,981,412 people shows a moderate positive correlation between the proportion of English and percentage of population with at least 3rd grade education in the United States with a correlation coefficient (R) of 0.407 and weighted average of 98.6%, a difference of 0.43%.
3rd Grade Correlation Summary
| Measurement | Immigrants from Sweden | English |
| Minimum | 96.5% | 93.3% |
| Maximum | 100.0% | 100.0% |
| Range | 3.5% | 6.7% |
| Mean | 99.3% | 99.0% |
| Median | 99.2% | 99.2% |
| Interquartile 25% (IQ1) | 98.9% | 98.8% |
| Interquartile 75% (IQ3) | 100.0% | 100.0% |
| Interquartile Range (IQR) | 1.1% | 1.2% |
| Standard Deviation (Sample) | 0.81% | 1.2% |
| Standard Deviation (Population) | 0.79% | 1.2% |
Similar Demographics by 3rd Grade
Demographics Similar to Immigrants from Sweden by 3rd Grade
In terms of 3rd grade, the demographic groups most similar to Immigrants from Sweden are Ukrainian (98.1%, a difference of 0.0%), Immigrants from Australia (98.1%, a difference of 0.0%), Potawatomi (98.1%, a difference of 0.0%), Immigrants from Denmark (98.1%, a difference of 0.0%), and Immigrants from India (98.1%, a difference of 0.0%).
| Demographics | Rating | Rank | 3rd Grade |
| Immigrants | Lithuania | 99.2 /100 | #77 | Exceptional 98.2% |
| Osage | 99.2 /100 | #78 | Exceptional 98.2% |
| Immigrants | Belgium | 99.1 /100 | #79 | Exceptional 98.1% |
| Macedonians | 99.1 /100 | #80 | Exceptional 98.1% |
| Icelanders | 99.1 /100 | #81 | Exceptional 98.1% |
| Shoshone | 99.0 /100 | #82 | Exceptional 98.1% |
| Ukrainians | 98.9 /100 | #83 | Exceptional 98.1% |
| Immigrants | Sweden | 98.9 /100 | #84 | Exceptional 98.1% |
| Immigrants | Australia | 98.9 /100 | #85 | Exceptional 98.1% |
| Potawatomi | 98.9 /100 | #86 | Exceptional 98.1% |
| Immigrants | Denmark | 98.8 /100 | #87 | Exceptional 98.1% |
| Immigrants | India | 98.8 /100 | #88 | Exceptional 98.1% |
| Delaware | 98.8 /100 | #89 | Exceptional 98.1% |
| Zimbabweans | 98.8 /100 | #90 | Exceptional 98.1% |
| Hopi | 98.7 /100 | #91 | Exceptional 98.1% |
Demographics Similar to English by 3rd Grade
In terms of 3rd grade, the demographic groups most similar to English are Tlingit-Haida (98.5%, a difference of 0.0%), Carpatho Rusyn (98.5%, a difference of 0.0%), Swedish (98.5%, a difference of 0.010%), Alaska Native (98.6%, a difference of 0.020%), and Slovene (98.6%, a difference of 0.020%).
| Demographics | Rating | Rank | 3rd Grade |
| Tsimshian | 100.0 /100 | #5 | Exceptional 98.8% |
| Alaskan Athabascans | 100.0 /100 | #6 | Exceptional 98.7% |
| Norwegians | 100.0 /100 | #7 | Exceptional 98.6% |
| Slovaks | 100.0 /100 | #8 | Exceptional 98.6% |
| Germans | 100.0 /100 | #9 | Exceptional 98.6% |
| Alaska Natives | 100.0 /100 | #10 | Exceptional 98.6% |
| Slovenes | 100.0 /100 | #11 | Exceptional 98.6% |
| English | 100.0 /100 | #12 | Exceptional 98.6% |
| Tlingit-Haida | 100.0 /100 | #13 | Exceptional 98.5% |
| Carpatho Rusyns | 100.0 /100 | #14 | Exceptional 98.5% |
| Swedes | 100.0 /100 | #15 | Exceptional 98.5% |
| Scottish | 100.0 /100 | #16 | Exceptional 98.5% |
| Dutch | 100.0 /100 | #17 | Exceptional 98.5% |
| Irish | 100.0 /100 | #18 | Exceptional 98.5% |
| Poles | 100.0 /100 | #19 | Exceptional 98.5% |