Immigrants from St. Vincent and the Grenadines vs Laotian Doctorate Degree
COMPARE
Immigrants from St. Vincent and the Grenadines
Laotian
Doctorate Degree
Doctorate Degree Comparison
Immigrants from St. Vincent and the Grenadines
Laotians
1.3%
DOCTORATE DEGREE
0.1/ 100
METRIC RATING
320th/ 347
METRIC RANK
2.3%
DOCTORATE DEGREE
99.9/ 100
METRIC RATING
63rd/ 347
METRIC RANK
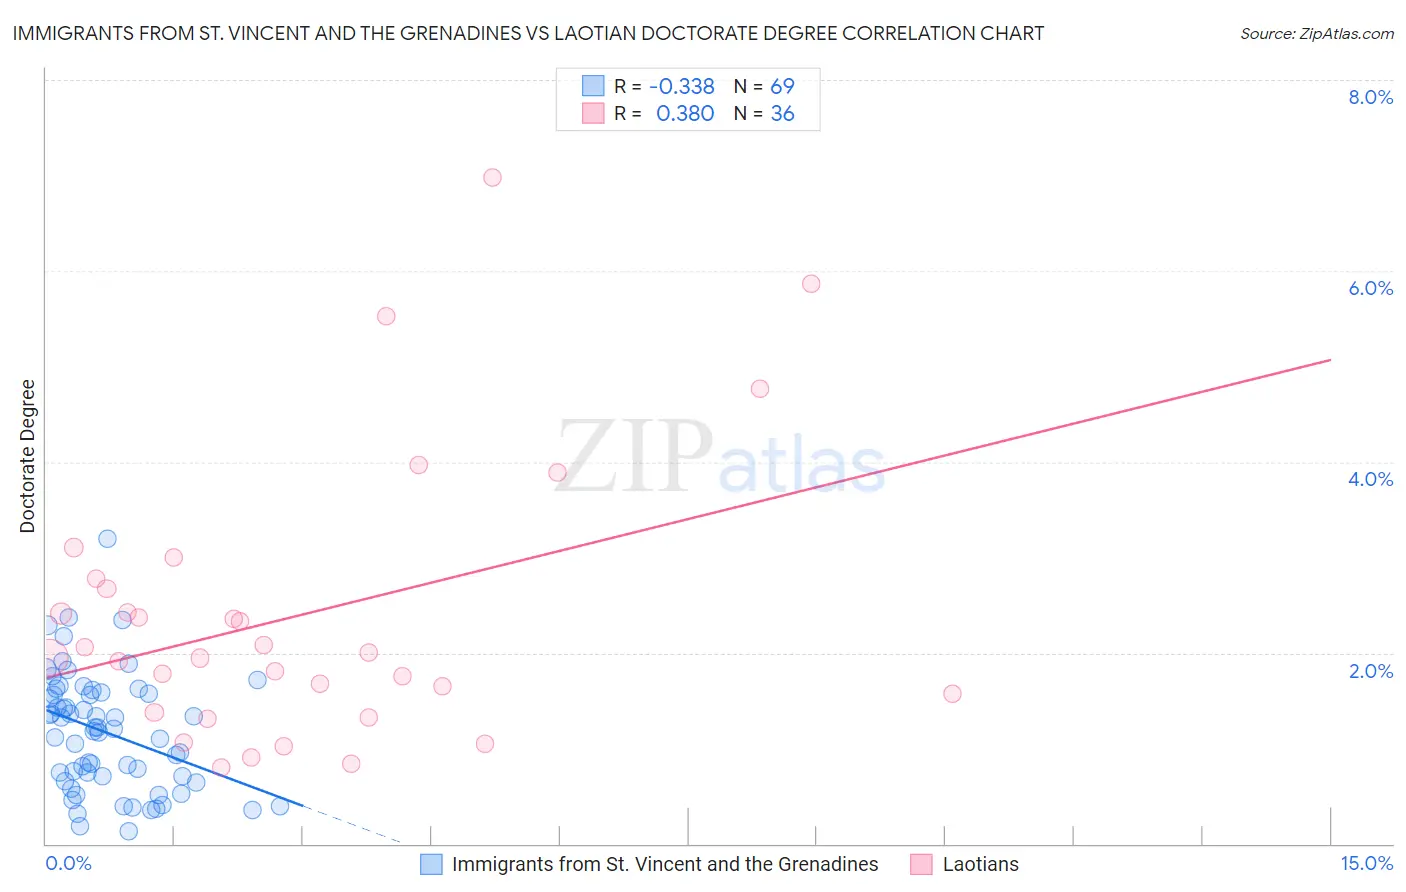
Immigrants from St. Vincent and the Grenadines vs Laotian Doctorate Degree Correlation Chart
The statistical analysis conducted on geographies consisting of 56,078,344 people shows a mild negative correlation between the proportion of Immigrants from St. Vincent and the Grenadines and percentage of population with at least doctorate degree education in the United States with a correlation coefficient (R) of -0.338 and weighted average of 1.3%. Similarly, the statistical analysis conducted on geographies consisting of 224,228,494 people shows a mild positive correlation between the proportion of Laotians and percentage of population with at least doctorate degree education in the United States with a correlation coefficient (R) of 0.380 and weighted average of 2.3%, a difference of 73.1%.
Doctorate Degree Correlation Summary
| Measurement | Immigrants from St. Vincent and the Grenadines | Laotian |
| Minimum | 0.13% | 0.80% |
| Maximum | 3.2% | 7.0% |
| Range | 3.1% | 6.2% |
| Mean | 1.2% | 2.4% |
| Median | 1.2% | 2.0% |
| Interquartile 25% (IQ1) | 0.68% | 1.5% |
| Interquartile 75% (IQ3) | 1.6% | 2.7% |
| Interquartile Range (IQR) | 0.90% | 1.3% |
| Standard Deviation (Sample) | 0.61% | 1.5% |
| Standard Deviation (Population) | 0.61% | 1.4% |
Similar Demographics by Doctorate Degree
Demographics Similar to Immigrants from St. Vincent and the Grenadines by Doctorate Degree
In terms of doctorate degree, the demographic groups most similar to Immigrants from St. Vincent and the Grenadines are Immigrants from Guyana (1.3%, a difference of 0.060%), Dutch West Indian (1.3%, a difference of 0.11%), Seminole (1.3%, a difference of 0.16%), Immigrants from Belize (1.3%, a difference of 0.36%), and Native/Alaskan (1.3%, a difference of 0.69%).
| Demographics | Rating | Rank | Doctorate Degree |
| Menominee | 0.1 /100 | #313 | Tragic 1.4% |
| Dominicans | 0.1 /100 | #314 | Tragic 1.4% |
| Immigrants | Azores | 0.1 /100 | #315 | Tragic 1.4% |
| Navajo | 0.1 /100 | #316 | Tragic 1.4% |
| Immigrants | Micronesia | 0.1 /100 | #317 | Tragic 1.3% |
| Creek | 0.1 /100 | #318 | Tragic 1.3% |
| Immigrants | Guyana | 0.1 /100 | #319 | Tragic 1.3% |
| Immigrants | St. Vincent and the Grenadines | 0.1 /100 | #320 | Tragic 1.3% |
| Dutch West Indians | 0.1 /100 | #321 | Tragic 1.3% |
| Seminole | 0.1 /100 | #322 | Tragic 1.3% |
| Immigrants | Belize | 0.1 /100 | #323 | Tragic 1.3% |
| Natives/Alaskans | 0.0 /100 | #324 | Tragic 1.3% |
| Pima | 0.0 /100 | #325 | Tragic 1.3% |
| Immigrants | Cabo Verde | 0.0 /100 | #326 | Tragic 1.3% |
| Hispanics or Latinos | 0.0 /100 | #327 | Tragic 1.3% |
Demographics Similar to Laotians by Doctorate Degree
In terms of doctorate degree, the demographic groups most similar to Laotians are Immigrants from Europe (2.3%, a difference of 0.090%), Immigrants from Greece (2.3%, a difference of 0.40%), Bhutanese (2.3%, a difference of 0.62%), Paraguayan (2.3%, a difference of 0.90%), and Argentinean (2.3%, a difference of 1.1%).
| Demographics | Rating | Rank | Doctorate Degree |
| Immigrants | Czechoslovakia | 100.0 /100 | #56 | Exceptional 2.4% |
| Immigrants | Ethiopia | 100.0 /100 | #57 | Exceptional 2.4% |
| Ethiopians | 99.9 /100 | #58 | Exceptional 2.3% |
| South Africans | 99.9 /100 | #59 | Exceptional 2.3% |
| Immigrants | Serbia | 99.9 /100 | #60 | Exceptional 2.3% |
| Bhutanese | 99.9 /100 | #61 | Exceptional 2.3% |
| Immigrants | Europe | 99.9 /100 | #62 | Exceptional 2.3% |
| Laotians | 99.9 /100 | #63 | Exceptional 2.3% |
| Immigrants | Greece | 99.9 /100 | #64 | Exceptional 2.3% |
| Paraguayans | 99.9 /100 | #65 | Exceptional 2.3% |
| Argentineans | 99.9 /100 | #66 | Exceptional 2.3% |
| Zimbabweans | 99.8 /100 | #67 | Exceptional 2.3% |
| Immigrants | Kazakhstan | 99.8 /100 | #68 | Exceptional 2.3% |
| Carpatho Rusyns | 99.8 /100 | #69 | Exceptional 2.3% |
| Lithuanians | 99.8 /100 | #70 | Exceptional 2.3% |