Immigrants from Sri Lanka vs Welsh 6th Grade
COMPARE
Immigrants from Sri Lanka
Welsh
6th Grade
6th Grade Comparison
Immigrants from Sri Lanka
Welsh
97.1%
6TH GRADE
51.7/ 100
METRIC RATING
171st/ 347
METRIC RANK
98.5%
6TH GRADE
100.0/ 100
METRIC RATING
3rd/ 347
METRIC RANK
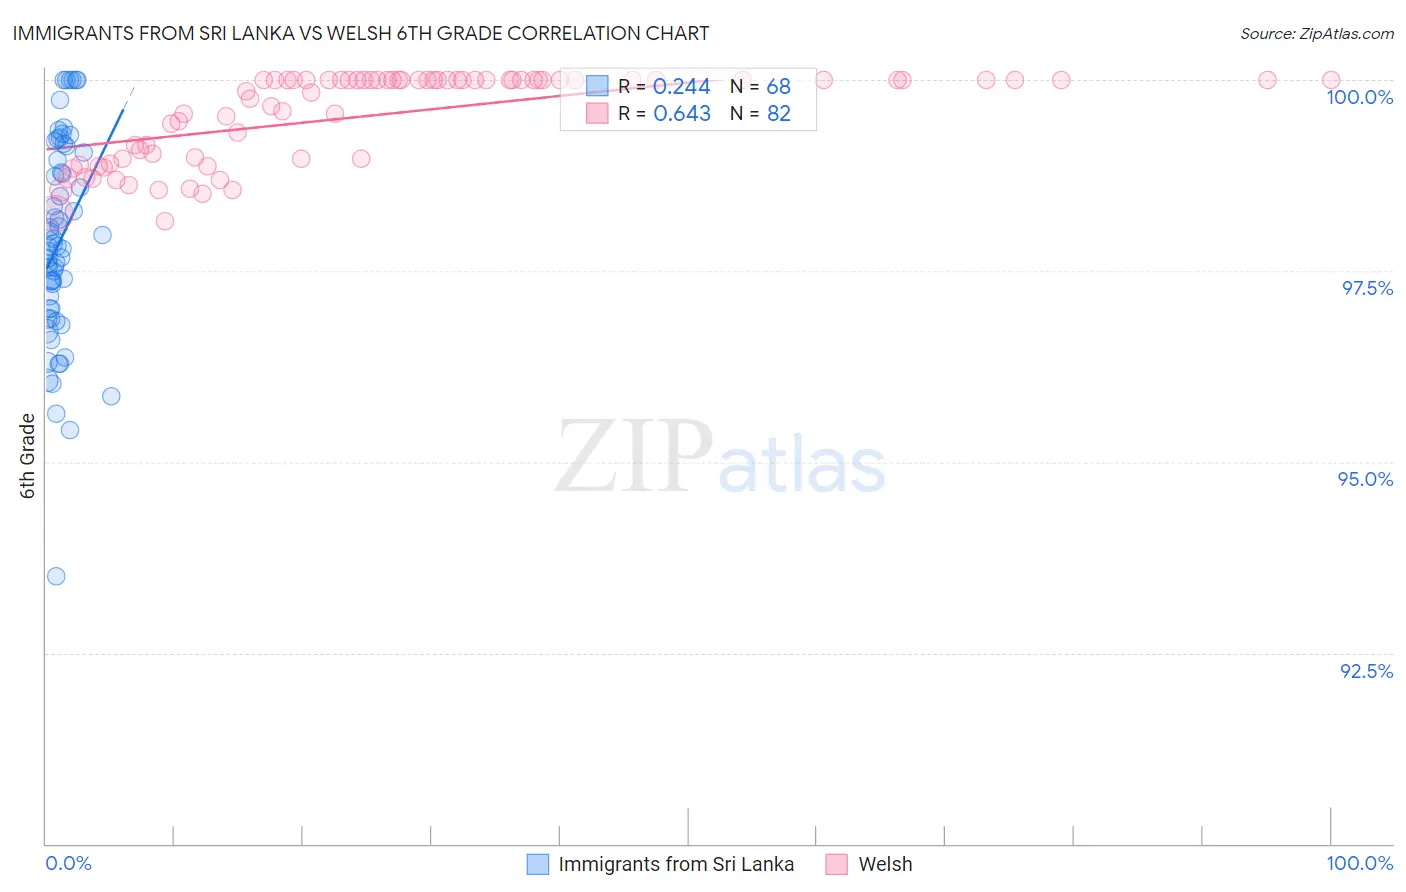
Immigrants from Sri Lanka vs Welsh 6th Grade Correlation Chart
The statistical analysis conducted on geographies consisting of 149,673,469 people shows a weak positive correlation between the proportion of Immigrants from Sri Lanka and percentage of population with at least 6th grade education in the United States with a correlation coefficient (R) of 0.244 and weighted average of 97.1%. Similarly, the statistical analysis conducted on geographies consisting of 239,959,962 people shows a significant positive correlation between the proportion of Welsh and percentage of population with at least 6th grade education in the United States with a correlation coefficient (R) of 0.643 and weighted average of 98.5%, a difference of 1.5%.
6th Grade Correlation Summary
| Measurement | Immigrants from Sri Lanka | Welsh |
| Minimum | 93.5% | 98.1% |
| Maximum | 100.0% | 100.0% |
| Range | 6.5% | 1.9% |
| Mean | 97.9% | 99.5% |
| Median | 97.8% | 100.0% |
| Interquartile 25% (IQ1) | 97.0% | 99.0% |
| Interquartile 75% (IQ3) | 99.0% | 100.0% |
| Interquartile Range (IQR) | 2.0% | 1.0% |
| Standard Deviation (Sample) | 1.3% | 0.58% |
| Standard Deviation (Population) | 1.3% | 0.58% |
Similar Demographics by 6th Grade
Demographics Similar to Immigrants from Sri Lanka by 6th Grade
In terms of 6th grade, the demographic groups most similar to Immigrants from Sri Lanka are Bermudan (97.1%, a difference of 0.0%), Chilean (97.1%, a difference of 0.0%), Egyptian (97.1%, a difference of 0.0%), Immigrants from Italy (97.1%, a difference of 0.010%), and Apache (97.1%, a difference of 0.010%).
| Demographics | Rating | Rank | 6th Grade |
| Immigrants | Korea | 57.7 /100 | #164 | Average 97.1% |
| Immigrants | Poland | 56.2 /100 | #165 | Average 97.1% |
| Immigrants | Italy | 53.8 /100 | #166 | Average 97.1% |
| Apache | 53.6 /100 | #167 | Average 97.1% |
| Immigrants | Taiwan | 53.5 /100 | #168 | Average 97.1% |
| Bermudans | 52.6 /100 | #169 | Average 97.1% |
| Chileans | 52.1 /100 | #170 | Average 97.1% |
| Immigrants | Sri Lanka | 51.7 /100 | #171 | Average 97.1% |
| Egyptians | 50.9 /100 | #172 | Average 97.1% |
| Arabs | 50.1 /100 | #173 | Average 97.0% |
| Venezuelans | 50.0 /100 | #174 | Average 97.0% |
| Immigrants | Kazakhstan | 47.3 /100 | #175 | Average 97.0% |
| Immigrants | Micronesia | 47.1 /100 | #176 | Average 97.0% |
| Mongolians | 46.7 /100 | #177 | Average 97.0% |
| Pakistanis | 46.0 /100 | #178 | Average 97.0% |
Demographics Similar to Welsh by 6th Grade
In terms of 6th grade, the demographic groups most similar to Welsh are Ottawa (98.5%, a difference of 0.010%), Dutch (98.4%, a difference of 0.13%), Tsimshian (98.3%, a difference of 0.20%), Norwegian (98.3%, a difference of 0.21%), and German (98.2%, a difference of 0.24%).
| Demographics | Rating | Rank | 6th Grade |
| Crow | 100.0 /100 | #1 | Exceptional 99.4% |
| Ottawa | 100.0 /100 | #2 | Exceptional 98.5% |
| Welsh | 100.0 /100 | #3 | Exceptional 98.5% |
| Dutch | 100.0 /100 | #4 | Exceptional 98.4% |
| Tsimshian | 100.0 /100 | #5 | Exceptional 98.3% |
| Norwegians | 100.0 /100 | #6 | Exceptional 98.3% |
| Germans | 100.0 /100 | #7 | Exceptional 98.2% |
| Slovaks | 100.0 /100 | #8 | Exceptional 98.2% |
| Slovenes | 100.0 /100 | #9 | Exceptional 98.2% |
| Swedes | 100.0 /100 | #10 | Exceptional 98.2% |
| English | 100.0 /100 | #11 | Exceptional 98.1% |
| Alaskan Athabascans | 100.0 /100 | #12 | Exceptional 98.1% |
| Tlingit-Haida | 100.0 /100 | #13 | Exceptional 98.1% |
| Carpatho Rusyns | 100.0 /100 | #14 | Exceptional 98.1% |
| Inupiat | 100.0 /100 | #15 | Exceptional 98.1% |