Immigrants from Portugal vs Welsh 6th Grade
COMPARE
Immigrants from Portugal
Welsh
6th Grade
6th Grade Comparison
Immigrants from Portugal
Welsh
95.5%
6TH GRADE
0.0/ 100
METRIC RATING
311th/ 347
METRIC RANK
98.5%
6TH GRADE
100.0/ 100
METRIC RATING
3rd/ 347
METRIC RANK
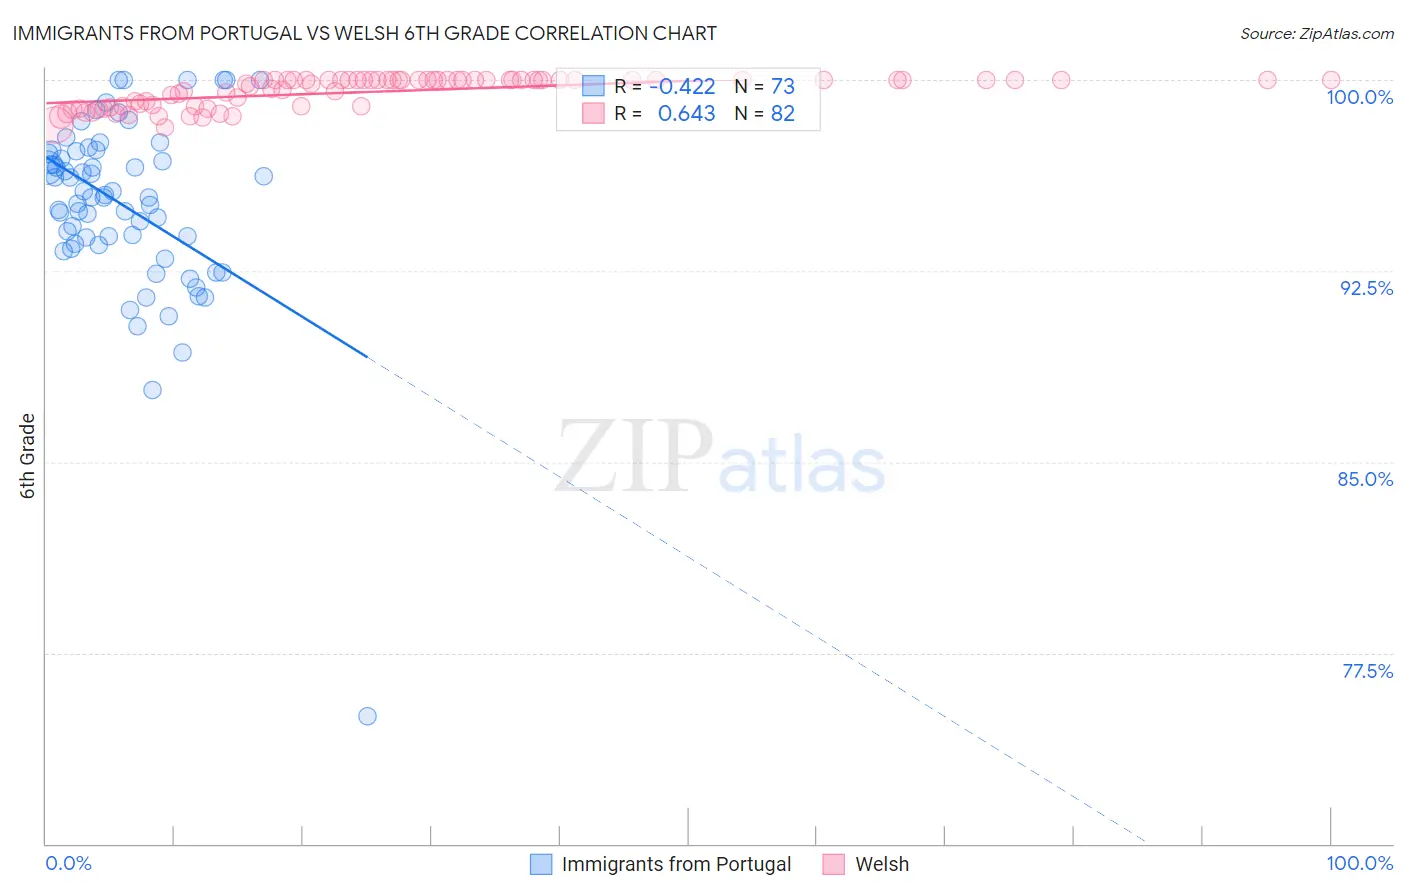
Immigrants from Portugal vs Welsh 6th Grade Correlation Chart
The statistical analysis conducted on geographies consisting of 174,792,107 people shows a moderate negative correlation between the proportion of Immigrants from Portugal and percentage of population with at least 6th grade education in the United States with a correlation coefficient (R) of -0.422 and weighted average of 95.5%. Similarly, the statistical analysis conducted on geographies consisting of 239,959,962 people shows a significant positive correlation between the proportion of Welsh and percentage of population with at least 6th grade education in the United States with a correlation coefficient (R) of 0.643 and weighted average of 98.5%, a difference of 3.2%.
6th Grade Correlation Summary
| Measurement | Immigrants from Portugal | Welsh |
| Minimum | 75.0% | 98.1% |
| Maximum | 100.0% | 100.0% |
| Range | 25.0% | 1.9% |
| Mean | 95.1% | 99.5% |
| Median | 95.4% | 100.0% |
| Interquartile 25% (IQ1) | 93.5% | 99.0% |
| Interquartile 75% (IQ3) | 97.2% | 100.0% |
| Interquartile Range (IQR) | 3.6% | 1.0% |
| Standard Deviation (Sample) | 3.6% | 0.58% |
| Standard Deviation (Population) | 3.6% | 0.58% |
Similar Demographics by 6th Grade
Demographics Similar to Immigrants from Portugal by 6th Grade
In terms of 6th grade, the demographic groups most similar to Immigrants from Portugal are Immigrants from Guyana (95.5%, a difference of 0.010%), Ecuadorian (95.5%, a difference of 0.020%), Puerto Rican (95.5%, a difference of 0.030%), Immigrants from Caribbean (95.6%, a difference of 0.080%), and Guyanese (95.6%, a difference of 0.090%).
| Demographics | Rating | Rank | 6th Grade |
| Indonesians | 0.0 /100 | #304 | Tragic 95.6% |
| Immigrants | Cuba | 0.0 /100 | #305 | Tragic 95.6% |
| Immigrants | Haiti | 0.0 /100 | #306 | Tragic 95.6% |
| Guyanese | 0.0 /100 | #307 | Tragic 95.6% |
| Immigrants | Caribbean | 0.0 /100 | #308 | Tragic 95.6% |
| Puerto Ricans | 0.0 /100 | #309 | Tragic 95.5% |
| Ecuadorians | 0.0 /100 | #310 | Tragic 95.5% |
| Immigrants | Portugal | 0.0 /100 | #311 | Tragic 95.5% |
| Immigrants | Guyana | 0.0 /100 | #312 | Tragic 95.5% |
| Nicaraguans | 0.0 /100 | #313 | Tragic 95.4% |
| Immigrants | Vietnam | 0.0 /100 | #314 | Tragic 95.4% |
| Immigrants | Bangladesh | 0.0 /100 | #315 | Tragic 95.4% |
| Japanese | 0.0 /100 | #316 | Tragic 95.4% |
| Vietnamese | 0.0 /100 | #317 | Tragic 95.3% |
| Belizeans | 0.0 /100 | #318 | Tragic 95.3% |
Demographics Similar to Welsh by 6th Grade
In terms of 6th grade, the demographic groups most similar to Welsh are Ottawa (98.5%, a difference of 0.010%), Dutch (98.4%, a difference of 0.13%), Tsimshian (98.3%, a difference of 0.20%), Norwegian (98.3%, a difference of 0.21%), and German (98.2%, a difference of 0.24%).
| Demographics | Rating | Rank | 6th Grade |
| Crow | 100.0 /100 | #1 | Exceptional 99.4% |
| Ottawa | 100.0 /100 | #2 | Exceptional 98.5% |
| Welsh | 100.0 /100 | #3 | Exceptional 98.5% |
| Dutch | 100.0 /100 | #4 | Exceptional 98.4% |
| Tsimshian | 100.0 /100 | #5 | Exceptional 98.3% |
| Norwegians | 100.0 /100 | #6 | Exceptional 98.3% |
| Germans | 100.0 /100 | #7 | Exceptional 98.2% |
| Slovaks | 100.0 /100 | #8 | Exceptional 98.2% |
| Slovenes | 100.0 /100 | #9 | Exceptional 98.2% |
| Swedes | 100.0 /100 | #10 | Exceptional 98.2% |
| English | 100.0 /100 | #11 | Exceptional 98.1% |
| Alaskan Athabascans | 100.0 /100 | #12 | Exceptional 98.1% |
| Tlingit-Haida | 100.0 /100 | #13 | Exceptional 98.1% |
| Carpatho Rusyns | 100.0 /100 | #14 | Exceptional 98.1% |
| Inupiat | 100.0 /100 | #15 | Exceptional 98.1% |