Immigrants from Sri Lanka vs Welsh Median Family Income
COMPARE
Immigrants from Sri Lanka
Welsh
Median Family Income
Median Family Income Comparison
Immigrants from Sri Lanka
Welsh
$120,263
MEDIAN FAMILY INCOME
100.0/ 100
METRIC RATING
30th/ 347
METRIC RANK
$102,151
MEDIAN FAMILY INCOME
43.3/ 100
METRIC RATING
178th/ 347
METRIC RANK
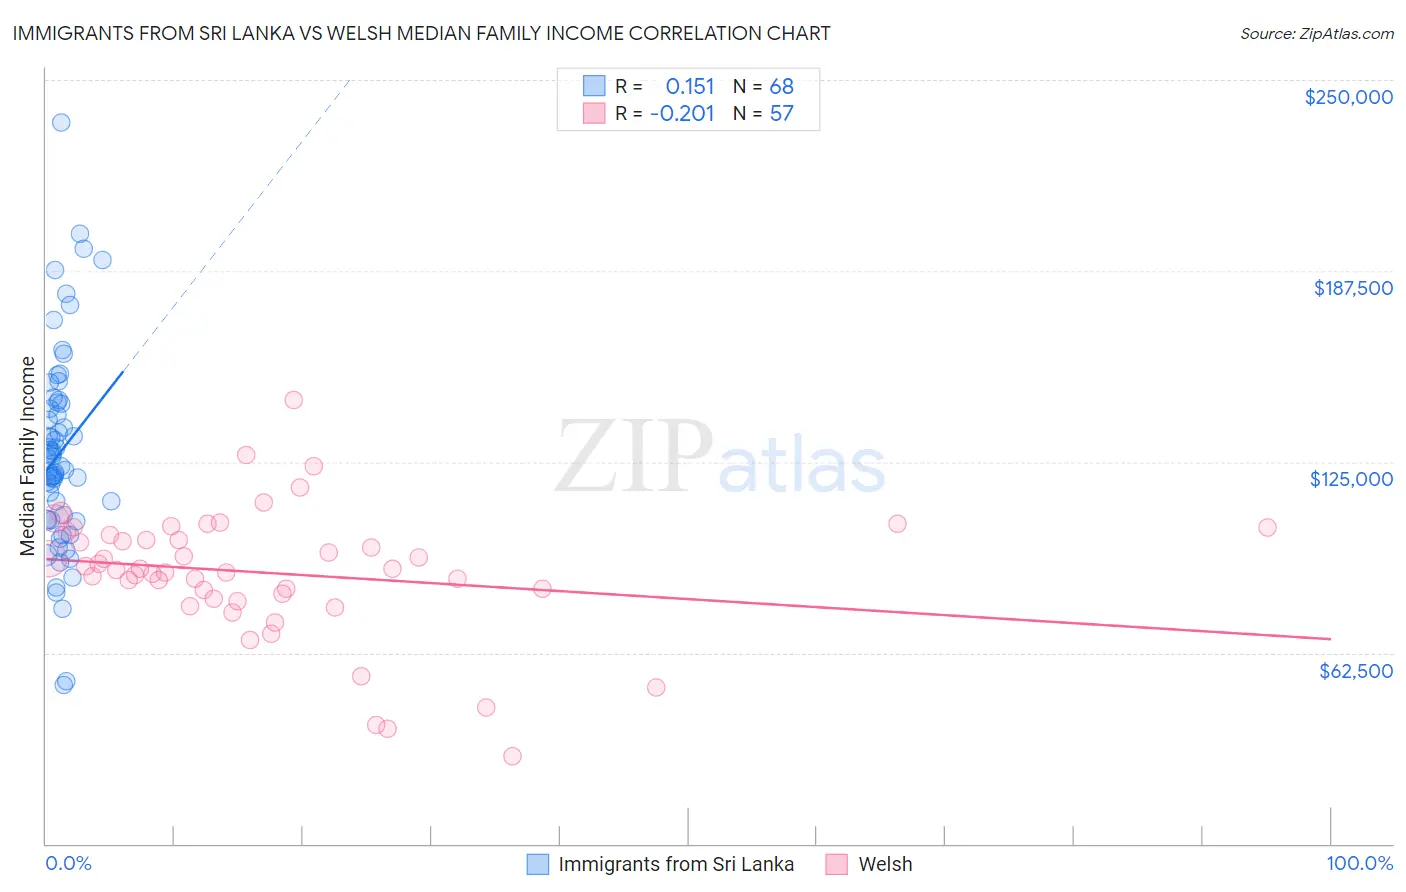
Immigrants from Sri Lanka vs Welsh Median Family Income Correlation Chart
The statistical analysis conducted on geographies consisting of 149,663,280 people shows a poor positive correlation between the proportion of Immigrants from Sri Lanka and median family income in the United States with a correlation coefficient (R) of 0.151 and weighted average of $120,263. Similarly, the statistical analysis conducted on geographies consisting of 527,824,493 people shows a weak negative correlation between the proportion of Welsh and median family income in the United States with a correlation coefficient (R) of -0.201 and weighted average of $102,151, a difference of 17.7%.
Median Family Income Correlation Summary
| Measurement | Immigrants from Sri Lanka | Welsh |
| Minimum | $51,807 | $28,750 |
| Maximum | $236,102 | $145,055 |
| Range | $184,295 | $116,305 |
| Mean | $127,906 | $88,686 |
| Median | $125,011 | $89,832 |
| Interquartile 25% (IQ1) | $106,120 | $80,992 |
| Interquartile 75% (IQ3) | $144,308 | $101,775 |
| Interquartile Range (IQR) | $38,188 | $20,783 |
| Standard Deviation (Sample) | $33,114 | $21,326 |
| Standard Deviation (Population) | $32,870 | $21,138 |
Similar Demographics by Median Family Income
Demographics Similar to Immigrants from Sri Lanka by Median Family Income
In terms of median family income, the demographic groups most similar to Immigrants from Sri Lanka are Latvian ($120,301, a difference of 0.030%), Immigrants from Denmark ($120,445, a difference of 0.15%), Immigrants from France ($120,076, a difference of 0.16%), Russian ($120,487, a difference of 0.19%), and Asian ($119,955, a difference of 0.26%).
| Demographics | Rating | Rank | Median Family Income |
| Immigrants | Japan | 100.0 /100 | #23 | Exceptional $122,764 |
| Immigrants | Northern Europe | 100.0 /100 | #24 | Exceptional $121,840 |
| Turks | 100.0 /100 | #25 | Exceptional $121,202 |
| Immigrants | Switzerland | 100.0 /100 | #26 | Exceptional $120,726 |
| Russians | 100.0 /100 | #27 | Exceptional $120,487 |
| Immigrants | Denmark | 100.0 /100 | #28 | Exceptional $120,445 |
| Latvians | 100.0 /100 | #29 | Exceptional $120,301 |
| Immigrants | Sri Lanka | 100.0 /100 | #30 | Exceptional $120,263 |
| Immigrants | France | 100.0 /100 | #31 | Exceptional $120,076 |
| Asians | 100.0 /100 | #32 | Exceptional $119,955 |
| Bhutanese | 100.0 /100 | #33 | Exceptional $119,800 |
| Bolivians | 100.0 /100 | #34 | Exceptional $119,479 |
| Soviet Union | 100.0 /100 | #35 | Exceptional $119,262 |
| Israelis | 100.0 /100 | #36 | Exceptional $118,577 |
| Australians | 100.0 /100 | #37 | Exceptional $118,440 |
Demographics Similar to Welsh by Median Family Income
In terms of median family income, the demographic groups most similar to Welsh are German ($102,254, a difference of 0.10%), French ($102,368, a difference of 0.21%), Immigrants from Eastern Africa ($102,451, a difference of 0.29%), South American ($101,856, a difference of 0.29%), and Finnish ($102,676, a difference of 0.51%).
| Demographics | Rating | Rank | Median Family Income |
| Alsatians | 54.3 /100 | #171 | Average $103,010 |
| Immigrants | Eritrea | 51.9 /100 | #172 | Average $102,823 |
| Belgians | 51.4 /100 | #173 | Average $102,788 |
| Finns | 50.0 /100 | #174 | Average $102,676 |
| Immigrants | Eastern Africa | 47.1 /100 | #175 | Average $102,451 |
| French | 46.1 /100 | #176 | Average $102,368 |
| Germans | 44.6 /100 | #177 | Average $102,254 |
| Welsh | 43.3 /100 | #178 | Average $102,151 |
| South Americans | 39.7 /100 | #179 | Fair $101,856 |
| French Canadians | 37.0 /100 | #180 | Fair $101,634 |
| Spaniards | 36.8 /100 | #181 | Fair $101,617 |
| Tsimshian | 35.9 /100 | #182 | Fair $101,543 |
| Kenyans | 34.5 /100 | #183 | Fair $101,417 |
| Immigrants | Costa Rica | 33.7 /100 | #184 | Fair $101,354 |
| Dutch | 31.9 /100 | #185 | Fair $101,192 |