Immigrants from Sri Lanka vs Burmese 6th Grade
COMPARE
Immigrants from Sri Lanka
Burmese
6th Grade
6th Grade Comparison
Immigrants from Sri Lanka
Burmese
97.1%
6TH GRADE
51.7/ 100
METRIC RATING
171st/ 347
METRIC RANK
97.3%
6TH GRADE
87.8/ 100
METRIC RATING
137th/ 347
METRIC RANK
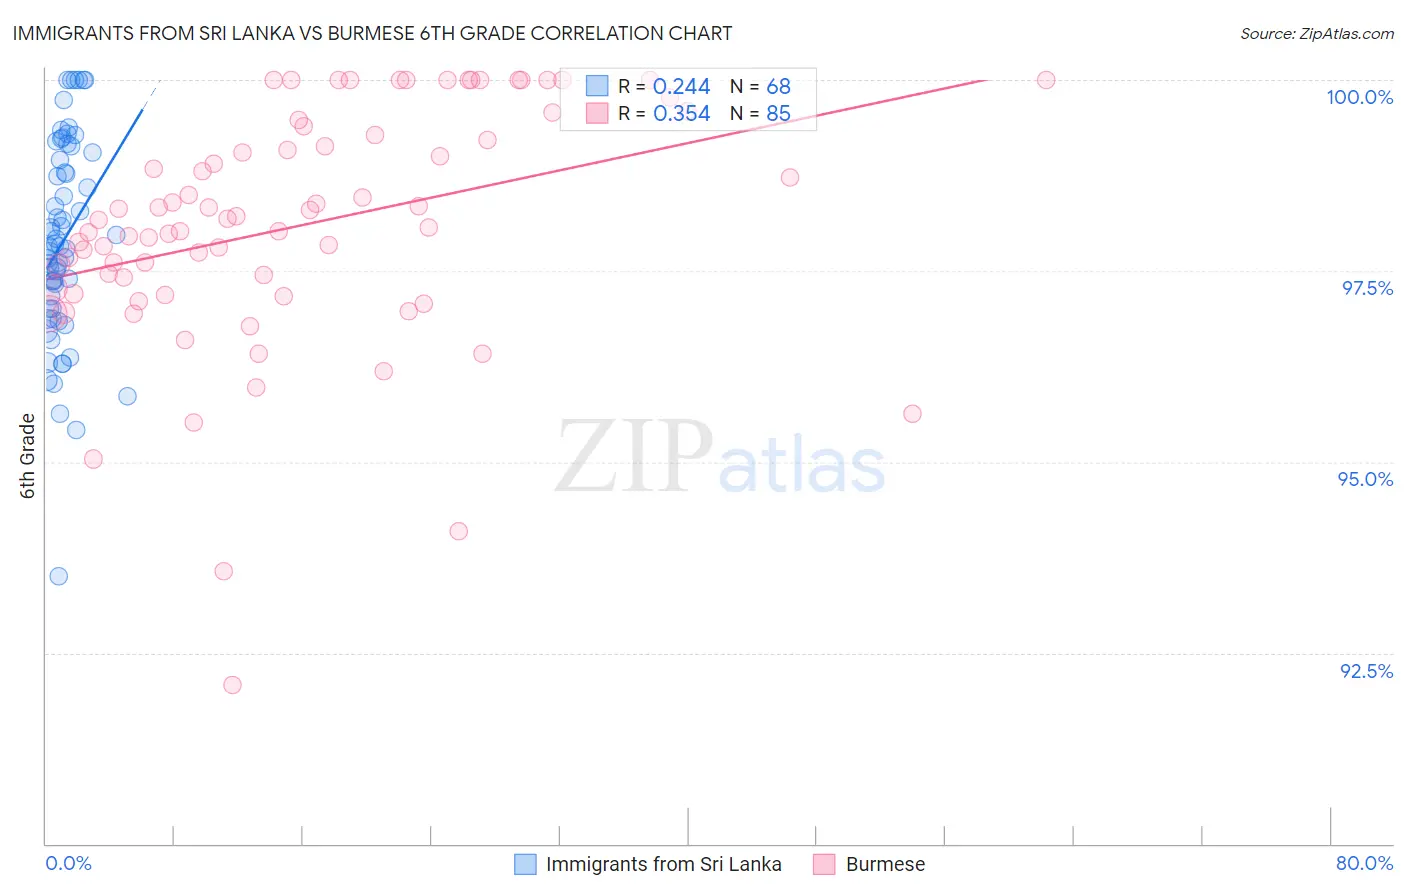
Immigrants from Sri Lanka vs Burmese 6th Grade Correlation Chart
The statistical analysis conducted on geographies consisting of 149,673,469 people shows a weak positive correlation between the proportion of Immigrants from Sri Lanka and percentage of population with at least 6th grade education in the United States with a correlation coefficient (R) of 0.244 and weighted average of 97.1%. Similarly, the statistical analysis conducted on geographies consisting of 465,275,994 people shows a mild positive correlation between the proportion of Burmese and percentage of population with at least 6th grade education in the United States with a correlation coefficient (R) of 0.354 and weighted average of 97.3%, a difference of 0.22%.
6th Grade Correlation Summary
| Measurement | Immigrants from Sri Lanka | Burmese |
| Minimum | 93.5% | 92.1% |
| Maximum | 100.0% | 100.0% |
| Range | 6.5% | 7.9% |
| Mean | 97.9% | 98.1% |
| Median | 97.8% | 98.2% |
| Interquartile 25% (IQ1) | 97.0% | 97.2% |
| Interquartile 75% (IQ3) | 99.0% | 99.3% |
| Interquartile Range (IQR) | 2.0% | 2.1% |
| Standard Deviation (Sample) | 1.3% | 1.6% |
| Standard Deviation (Population) | 1.3% | 1.5% |
Similar Demographics by 6th Grade
Demographics Similar to Immigrants from Sri Lanka by 6th Grade
In terms of 6th grade, the demographic groups most similar to Immigrants from Sri Lanka are Bermudan (97.1%, a difference of 0.0%), Chilean (97.1%, a difference of 0.0%), Egyptian (97.1%, a difference of 0.0%), Immigrants from Italy (97.1%, a difference of 0.010%), and Apache (97.1%, a difference of 0.010%).
| Demographics | Rating | Rank | 6th Grade |
| Immigrants | Korea | 57.7 /100 | #164 | Average 97.1% |
| Immigrants | Poland | 56.2 /100 | #165 | Average 97.1% |
| Immigrants | Italy | 53.8 /100 | #166 | Average 97.1% |
| Apache | 53.6 /100 | #167 | Average 97.1% |
| Immigrants | Taiwan | 53.5 /100 | #168 | Average 97.1% |
| Bermudans | 52.6 /100 | #169 | Average 97.1% |
| Chileans | 52.1 /100 | #170 | Average 97.1% |
| Immigrants | Sri Lanka | 51.7 /100 | #171 | Average 97.1% |
| Egyptians | 50.9 /100 | #172 | Average 97.1% |
| Arabs | 50.1 /100 | #173 | Average 97.0% |
| Venezuelans | 50.0 /100 | #174 | Average 97.0% |
| Immigrants | Kazakhstan | 47.3 /100 | #175 | Average 97.0% |
| Immigrants | Micronesia | 47.1 /100 | #176 | Average 97.0% |
| Mongolians | 46.7 /100 | #177 | Average 97.0% |
| Pakistanis | 46.0 /100 | #178 | Average 97.0% |
Demographics Similar to Burmese by 6th Grade
In terms of 6th grade, the demographic groups most similar to Burmese are Blackfeet (97.3%, a difference of 0.0%), Filipino (97.3%, a difference of 0.010%), Immigrants from Kuwait (97.3%, a difference of 0.020%), Immigrants from Hungary (97.3%, a difference of 0.020%), and Immigrants from Turkey (97.3%, a difference of 0.020%).
| Demographics | Rating | Rank | 6th Grade |
| Cambodians | 91.8 /100 | #130 | Exceptional 97.3% |
| Immigrants | Europe | 91.1 /100 | #131 | Exceptional 97.3% |
| Palestinians | 90.9 /100 | #132 | Exceptional 97.3% |
| Immigrants | Moldova | 90.0 /100 | #133 | Excellent 97.3% |
| Immigrants | Kuwait | 89.5 /100 | #134 | Excellent 97.3% |
| Immigrants | Hungary | 89.5 /100 | #135 | Excellent 97.3% |
| Filipinos | 88.9 /100 | #136 | Excellent 97.3% |
| Burmese | 87.8 /100 | #137 | Excellent 97.3% |
| Blackfeet | 87.7 /100 | #138 | Excellent 97.3% |
| Immigrants | Turkey | 86.1 /100 | #139 | Excellent 97.3% |
| Immigrants | North Macedonia | 85.5 /100 | #140 | Excellent 97.2% |
| Seminole | 84.8 /100 | #141 | Excellent 97.2% |
| Jordanians | 84.6 /100 | #142 | Excellent 97.2% |
| Pima | 82.9 /100 | #143 | Excellent 97.2% |
| Israelis | 82.9 /100 | #144 | Excellent 97.2% |