Immigrants from Sri Lanka vs Welsh In Labor Force | Age 16-19
COMPARE
Immigrants from Sri Lanka
Welsh
In Labor Force | Age 16-19
In Labor Force | Age 16-19 Comparison
Immigrants from Sri Lanka
Welsh
34.9%
IN LABOR FORCE | AGE 16-19
2.4/ 100
METRIC RATING
246th/ 347
METRIC RANK
42.3%
IN LABOR FORCE | AGE 16-19
100.0/ 100
METRIC RATING
27th/ 347
METRIC RANK
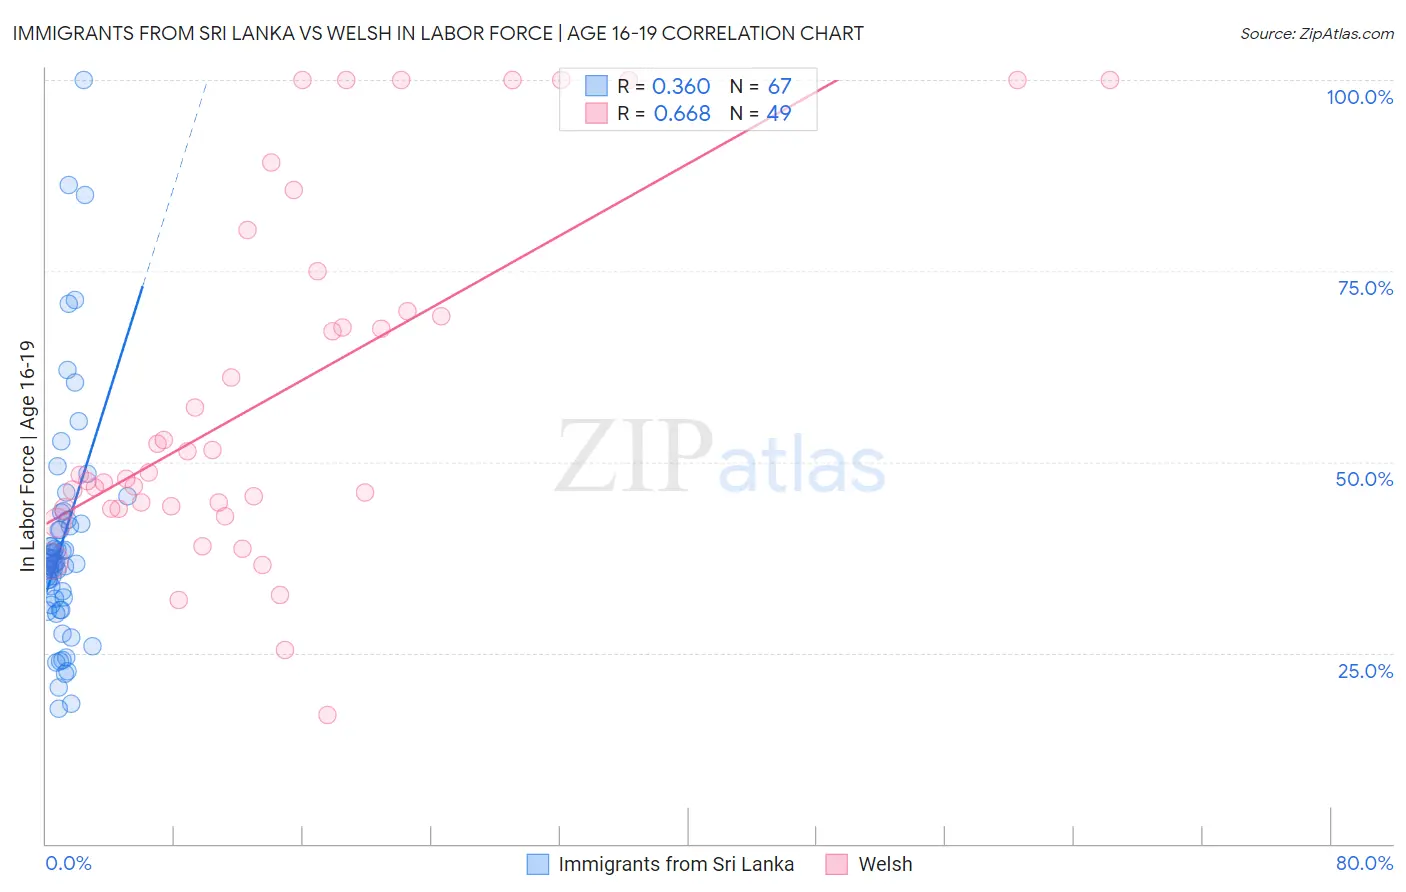
Immigrants from Sri Lanka vs Welsh In Labor Force | Age 16-19 Correlation Chart
The statistical analysis conducted on geographies consisting of 149,654,702 people shows a mild positive correlation between the proportion of Immigrants from Sri Lanka and labor force participation rate among population between the ages 16 and 19 in the United States with a correlation coefficient (R) of 0.360 and weighted average of 34.9%. Similarly, the statistical analysis conducted on geographies consisting of 526,098,531 people shows a significant positive correlation between the proportion of Welsh and labor force participation rate among population between the ages 16 and 19 in the United States with a correlation coefficient (R) of 0.668 and weighted average of 42.3%, a difference of 21.2%.
In Labor Force | Age 16-19 Correlation Summary
| Measurement | Immigrants from Sri Lanka | Welsh |
| Minimum | 17.6% | 16.8% |
| Maximum | 100.0% | 100.0% |
| Range | 82.4% | 83.2% |
| Mean | 39.5% | 58.7% |
| Median | 36.7% | 48.3% |
| Interquartile 25% (IQ1) | 31.2% | 43.9% |
| Interquartile 75% (IQ3) | 41.9% | 72.3% |
| Interquartile Range (IQR) | 10.7% | 28.4% |
| Standard Deviation (Sample) | 15.4% | 23.2% |
| Standard Deviation (Population) | 15.3% | 23.0% |
Similar Demographics by In Labor Force | Age 16-19
Demographics Similar to Immigrants from Sri Lanka by In Labor Force | Age 16-19
In terms of in labor force | age 16-19, the demographic groups most similar to Immigrants from Sri Lanka are Laotian (34.9%, a difference of 0.010%), Immigrants from Greece (34.9%, a difference of 0.020%), Immigrants from Turkey (34.9%, a difference of 0.080%), Central American (34.8%, a difference of 0.090%), and Pueblo (34.9%, a difference of 0.10%).
| Demographics | Rating | Rank | In Labor Force | Age 16-19 |
| Inupiat | 3.2 /100 | #239 | Tragic 35.0% |
| Immigrants | Central America | 3.0 /100 | #240 | Tragic 35.0% |
| Immigrants | Ireland | 2.9 /100 | #241 | Tragic 35.0% |
| Uruguayans | 2.6 /100 | #242 | Tragic 34.9% |
| Pueblo | 2.6 /100 | #243 | Tragic 34.9% |
| Immigrants | Turkey | 2.6 /100 | #244 | Tragic 34.9% |
| Immigrants | Greece | 2.4 /100 | #245 | Tragic 34.9% |
| Immigrants | Sri Lanka | 2.4 /100 | #246 | Tragic 34.9% |
| Laotians | 2.4 /100 | #247 | Tragic 34.9% |
| Central Americans | 2.2 /100 | #248 | Tragic 34.8% |
| Immigrants | Ukraine | 2.2 /100 | #249 | Tragic 34.8% |
| Immigrants | Pakistan | 2.0 /100 | #250 | Tragic 34.8% |
| Immigrants | Western Asia | 2.0 /100 | #251 | Tragic 34.8% |
| Immigrants | Chile | 2.0 /100 | #252 | Tragic 34.8% |
| Immigrants | Japan | 1.5 /100 | #253 | Tragic 34.7% |
Demographics Similar to Welsh by In Labor Force | Age 16-19
In terms of in labor force | age 16-19, the demographic groups most similar to Welsh are English (42.4%, a difference of 0.28%), Polish (42.1%, a difference of 0.29%), French (42.1%, a difference of 0.35%), German Russian (42.4%, a difference of 0.40%), and Bangladeshi (42.5%, a difference of 0.48%).
| Demographics | Rating | Rank | In Labor Force | Age 16-19 |
| Swiss | 100.0 /100 | #20 | Exceptional 43.3% |
| Ottawa | 100.0 /100 | #21 | Exceptional 43.0% |
| Sudanese | 100.0 /100 | #22 | Exceptional 42.9% |
| Slovaks | 100.0 /100 | #23 | Exceptional 42.6% |
| Bangladeshis | 100.0 /100 | #24 | Exceptional 42.5% |
| German Russians | 100.0 /100 | #25 | Exceptional 42.4% |
| English | 100.0 /100 | #26 | Exceptional 42.4% |
| Welsh | 100.0 /100 | #27 | Exceptional 42.3% |
| Poles | 100.0 /100 | #28 | Exceptional 42.1% |
| French | 100.0 /100 | #29 | Exceptional 42.1% |
| Scottish | 100.0 /100 | #30 | Exceptional 42.0% |
| Irish | 100.0 /100 | #31 | Exceptional 42.0% |
| Czechoslovakians | 100.0 /100 | #32 | Exceptional 41.9% |
| Liberians | 100.0 /100 | #33 | Exceptional 41.8% |
| Immigrants | Bosnia and Herzegovina | 100.0 /100 | #34 | Exceptional 41.8% |