Immigrants from Romania vs Welsh 6th Grade
COMPARE
Immigrants from Romania
Welsh
6th Grade
6th Grade Comparison
Immigrants from Romania
Welsh
97.3%
6TH GRADE
92.0/ 100
METRIC RATING
128th/ 347
METRIC RANK
98.5%
6TH GRADE
100.0/ 100
METRIC RATING
3rd/ 347
METRIC RANK
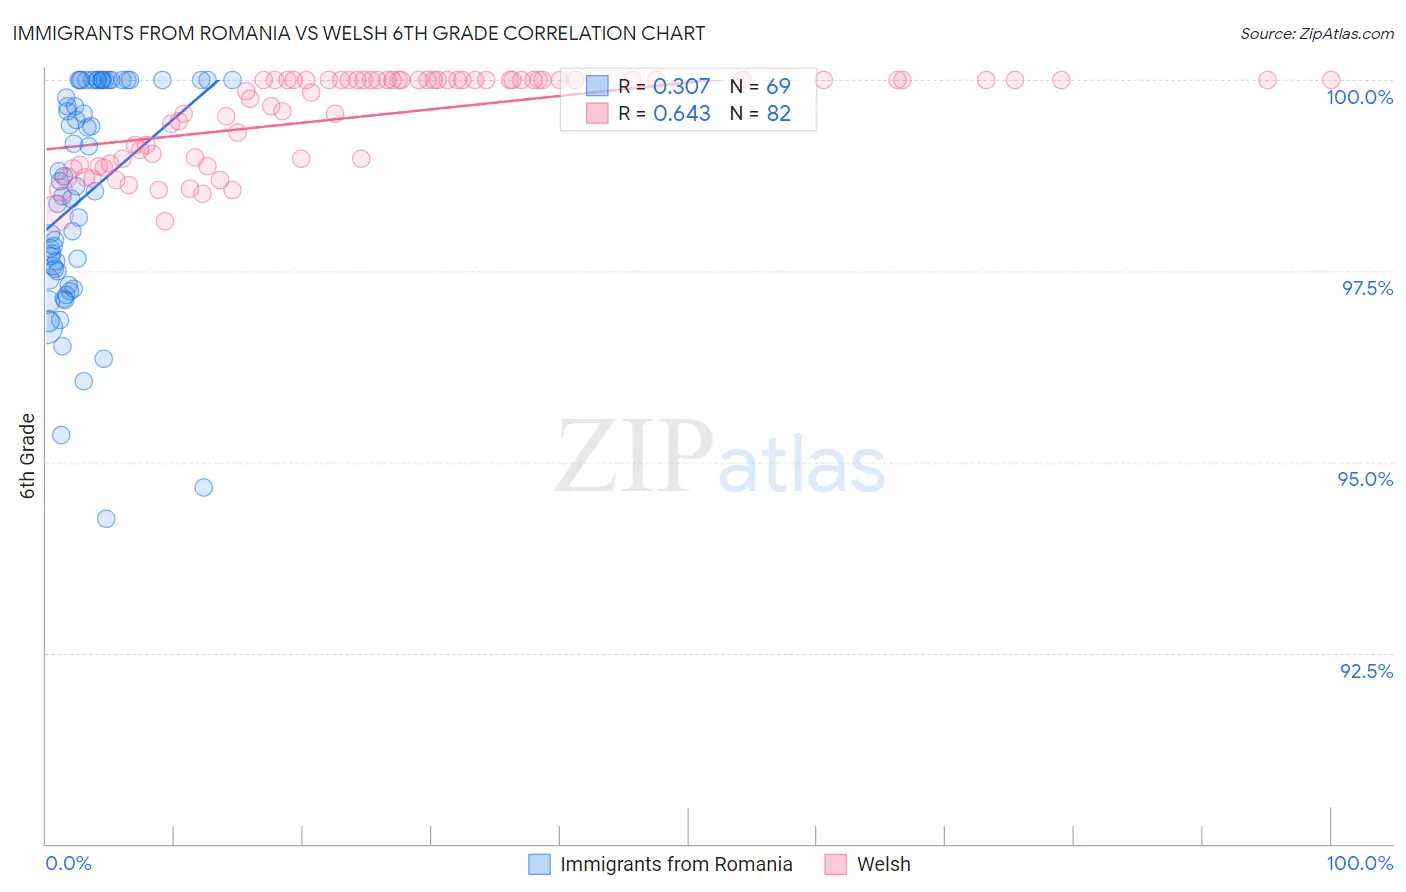
Immigrants from Romania vs Welsh 6th Grade Correlation Chart
The statistical analysis conducted on geographies consisting of 257,008,799 people shows a mild positive correlation between the proportion of Immigrants from Romania and percentage of population with at least 6th grade education in the United States with a correlation coefficient (R) of 0.307 and weighted average of 97.3%. Similarly, the statistical analysis conducted on geographies consisting of 239,959,962 people shows a significant positive correlation between the proportion of Welsh and percentage of population with at least 6th grade education in the United States with a correlation coefficient (R) of 0.643 and weighted average of 98.5%, a difference of 1.2%.
6th Grade Correlation Summary
| Measurement | Immigrants from Romania | Welsh |
| Minimum | 94.3% | 98.1% |
| Maximum | 100.0% | 100.0% |
| Range | 5.7% | 1.9% |
| Mean | 98.5% | 99.5% |
| Median | 98.6% | 100.0% |
| Interquartile 25% (IQ1) | 97.4% | 99.0% |
| Interquartile 75% (IQ3) | 100.0% | 100.0% |
| Interquartile Range (IQR) | 2.6% | 1.0% |
| Standard Deviation (Sample) | 1.4% | 0.58% |
| Standard Deviation (Population) | 1.4% | 0.58% |
Similar Demographics by 6th Grade
Demographics Similar to Immigrants from Romania by 6th Grade
In terms of 6th grade, the demographic groups most similar to Immigrants from Romania are Immigrants from Serbia (97.3%, a difference of 0.0%), Cambodian (97.3%, a difference of 0.0%), Immigrants from Europe (97.3%, a difference of 0.010%), Immigrants from Croatia (97.3%, a difference of 0.020%), and Palestinian (97.3%, a difference of 0.020%).
| Demographics | Rating | Rank | 6th Grade |
| Immigrants | Norway | 94.7 /100 | #121 | Exceptional 97.4% |
| Immigrants | France | 94.5 /100 | #122 | Exceptional 97.4% |
| Hmong | 94.4 /100 | #123 | Exceptional 97.4% |
| Okinawans | 94.2 /100 | #124 | Exceptional 97.4% |
| Spanish | 93.7 /100 | #125 | Exceptional 97.3% |
| Immigrants | Bulgaria | 93.6 /100 | #126 | Exceptional 97.3% |
| Immigrants | Croatia | 93.1 /100 | #127 | Exceptional 97.3% |
| Immigrants | Romania | 92.0 /100 | #128 | Exceptional 97.3% |
| Immigrants | Serbia | 91.9 /100 | #129 | Exceptional 97.3% |
| Cambodians | 91.8 /100 | #130 | Exceptional 97.3% |
| Immigrants | Europe | 91.1 /100 | #131 | Exceptional 97.3% |
| Palestinians | 90.9 /100 | #132 | Exceptional 97.3% |
| Immigrants | Moldova | 90.0 /100 | #133 | Excellent 97.3% |
| Immigrants | Kuwait | 89.5 /100 | #134 | Excellent 97.3% |
| Immigrants | Hungary | 89.5 /100 | #135 | Excellent 97.3% |
Demographics Similar to Welsh by 6th Grade
In terms of 6th grade, the demographic groups most similar to Welsh are Ottawa (98.5%, a difference of 0.010%), Dutch (98.4%, a difference of 0.13%), Tsimshian (98.3%, a difference of 0.20%), Norwegian (98.3%, a difference of 0.21%), and German (98.2%, a difference of 0.24%).
| Demographics | Rating | Rank | 6th Grade |
| Crow | 100.0 /100 | #1 | Exceptional 99.4% |
| Ottawa | 100.0 /100 | #2 | Exceptional 98.5% |
| Welsh | 100.0 /100 | #3 | Exceptional 98.5% |
| Dutch | 100.0 /100 | #4 | Exceptional 98.4% |
| Tsimshian | 100.0 /100 | #5 | Exceptional 98.3% |
| Norwegians | 100.0 /100 | #6 | Exceptional 98.3% |
| Germans | 100.0 /100 | #7 | Exceptional 98.2% |
| Slovaks | 100.0 /100 | #8 | Exceptional 98.2% |
| Slovenes | 100.0 /100 | #9 | Exceptional 98.2% |
| Swedes | 100.0 /100 | #10 | Exceptional 98.2% |
| English | 100.0 /100 | #11 | Exceptional 98.1% |
| Alaskan Athabascans | 100.0 /100 | #12 | Exceptional 98.1% |
| Tlingit-Haida | 100.0 /100 | #13 | Exceptional 98.1% |
| Carpatho Rusyns | 100.0 /100 | #14 | Exceptional 98.1% |
| Inupiat | 100.0 /100 | #15 | Exceptional 98.1% |