Immigrants from West Indies vs Iranian Master's Degree
COMPARE
Immigrants from West Indies
Iranian
Master's Degree
Master's Degree Comparison
Immigrants from West Indies
Iranians
13.9%
MASTER'S DEGREE
9.8/ 100
METRIC RATING
227th/ 347
METRIC RANK
22.3%
MASTER'S DEGREE
100.0/ 100
METRIC RATING
7th/ 347
METRIC RANK
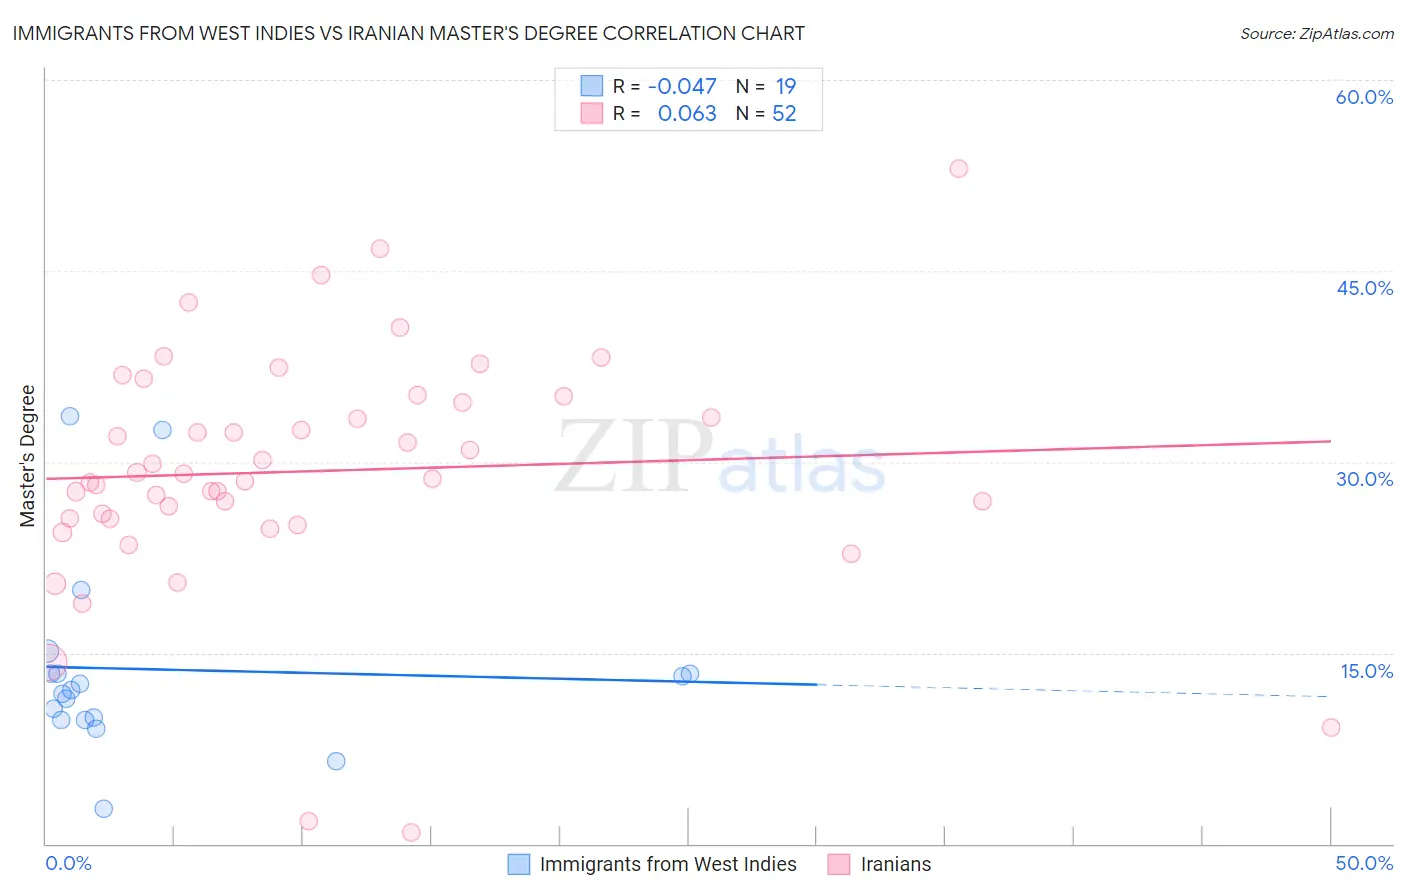
Immigrants from West Indies vs Iranian Master's Degree Correlation Chart
The statistical analysis conducted on geographies consisting of 72,456,461 people shows no correlation between the proportion of Immigrants from West Indies and percentage of population with at least master's degree education in the United States with a correlation coefficient (R) of -0.047 and weighted average of 13.9%. Similarly, the statistical analysis conducted on geographies consisting of 316,817,608 people shows a slight positive correlation between the proportion of Iranians and percentage of population with at least master's degree education in the United States with a correlation coefficient (R) of 0.063 and weighted average of 22.3%, a difference of 60.6%.
Master's Degree Correlation Summary
| Measurement | Immigrants from West Indies | Iranian |
| Minimum | 2.7% | 0.89% |
| Maximum | 33.6% | 53.0% |
| Range | 30.8% | 52.1% |
| Mean | 13.7% | 29.3% |
| Median | 12.1% | 28.9% |
| Interquartile 25% (IQ1) | 9.7% | 25.5% |
| Interquartile 75% (IQ3) | 13.4% | 34.9% |
| Interquartile Range (IQR) | 3.7% | 9.4% |
| Standard Deviation (Sample) | 7.6% | 9.6% |
| Standard Deviation (Population) | 7.4% | 9.5% |
Similar Demographics by Master's Degree
Demographics Similar to Immigrants from West Indies by Master's Degree
In terms of master's degree, the demographic groups most similar to Immigrants from West Indies are White/Caucasian (13.8%, a difference of 0.31%), British West Indian (13.8%, a difference of 0.42%), Immigrants from St. Vincent and the Grenadines (13.9%, a difference of 0.44%), Dutch (13.8%, a difference of 0.45%), and Portuguese (13.9%, a difference of 0.50%).
| Demographics | Rating | Rank | Master's Degree |
| Germans | 13.1 /100 | #220 | Poor 14.0% |
| Koreans | 12.7 /100 | #221 | Poor 14.0% |
| Ecuadorians | 12.6 /100 | #222 | Poor 14.0% |
| Immigrants | South Eastern Asia | 11.9 /100 | #223 | Poor 14.0% |
| Immigrants | Grenada | 11.8 /100 | #224 | Poor 14.0% |
| Portuguese | 11.2 /100 | #225 | Poor 13.9% |
| Immigrants | St. Vincent and the Grenadines | 11.0 /100 | #226 | Poor 13.9% |
| Immigrants | West Indies | 9.8 /100 | #227 | Tragic 13.9% |
| Whites/Caucasians | 9.1 /100 | #228 | Tragic 13.8% |
| British West Indians | 8.8 /100 | #229 | Tragic 13.8% |
| Dutch | 8.7 /100 | #230 | Tragic 13.8% |
| Guyanese | 7.6 /100 | #231 | Tragic 13.7% |
| Immigrants | Philippines | 6.0 /100 | #232 | Tragic 13.6% |
| Immigrants | Ecuador | 5.7 /100 | #233 | Tragic 13.6% |
| Immigrants | Burma/Myanmar | 5.0 /100 | #234 | Tragic 13.5% |
Demographics Similar to Iranians by Master's Degree
In terms of master's degree, the demographic groups most similar to Iranians are Immigrants from India (22.3%, a difference of 0.21%), Immigrants from Taiwan (22.5%, a difference of 0.88%), Immigrants from Israel (22.6%, a difference of 1.7%), Okinawan (22.6%, a difference of 1.7%), and Cypriot (21.8%, a difference of 2.2%).
| Demographics | Rating | Rank | Master's Degree |
| Immigrants | Singapore | 100.0 /100 | #1 | Exceptional 23.4% |
| Filipinos | 100.0 /100 | #2 | Exceptional 23.4% |
| Immigrants | Israel | 100.0 /100 | #3 | Exceptional 22.6% |
| Okinawans | 100.0 /100 | #4 | Exceptional 22.6% |
| Immigrants | Taiwan | 100.0 /100 | #5 | Exceptional 22.5% |
| Immigrants | India | 100.0 /100 | #6 | Exceptional 22.3% |
| Iranians | 100.0 /100 | #7 | Exceptional 22.3% |
| Cypriots | 100.0 /100 | #8 | Exceptional 21.8% |
| Thais | 100.0 /100 | #9 | Exceptional 21.7% |
| Immigrants | Iran | 100.0 /100 | #10 | Exceptional 21.6% |
| Immigrants | China | 100.0 /100 | #11 | Exceptional 21.2% |
| Eastern Europeans | 100.0 /100 | #12 | Exceptional 21.1% |
| Immigrants | Australia | 100.0 /100 | #13 | Exceptional 20.9% |
| Immigrants | Switzerland | 100.0 /100 | #14 | Exceptional 20.9% |
| Immigrants | Eastern Asia | 100.0 /100 | #15 | Exceptional 20.8% |