Immigrants from Southern Europe vs Iranian Master's Degree
COMPARE
Immigrants from Southern Europe
Iranian
Master's Degree
Master's Degree Comparison
Immigrants from Southern Europe
Iranians
16.6%
MASTER'S DEGREE
97.2/ 100
METRIC RATING
116th/ 347
METRIC RANK
22.3%
MASTER'S DEGREE
100.0/ 100
METRIC RATING
7th/ 347
METRIC RANK
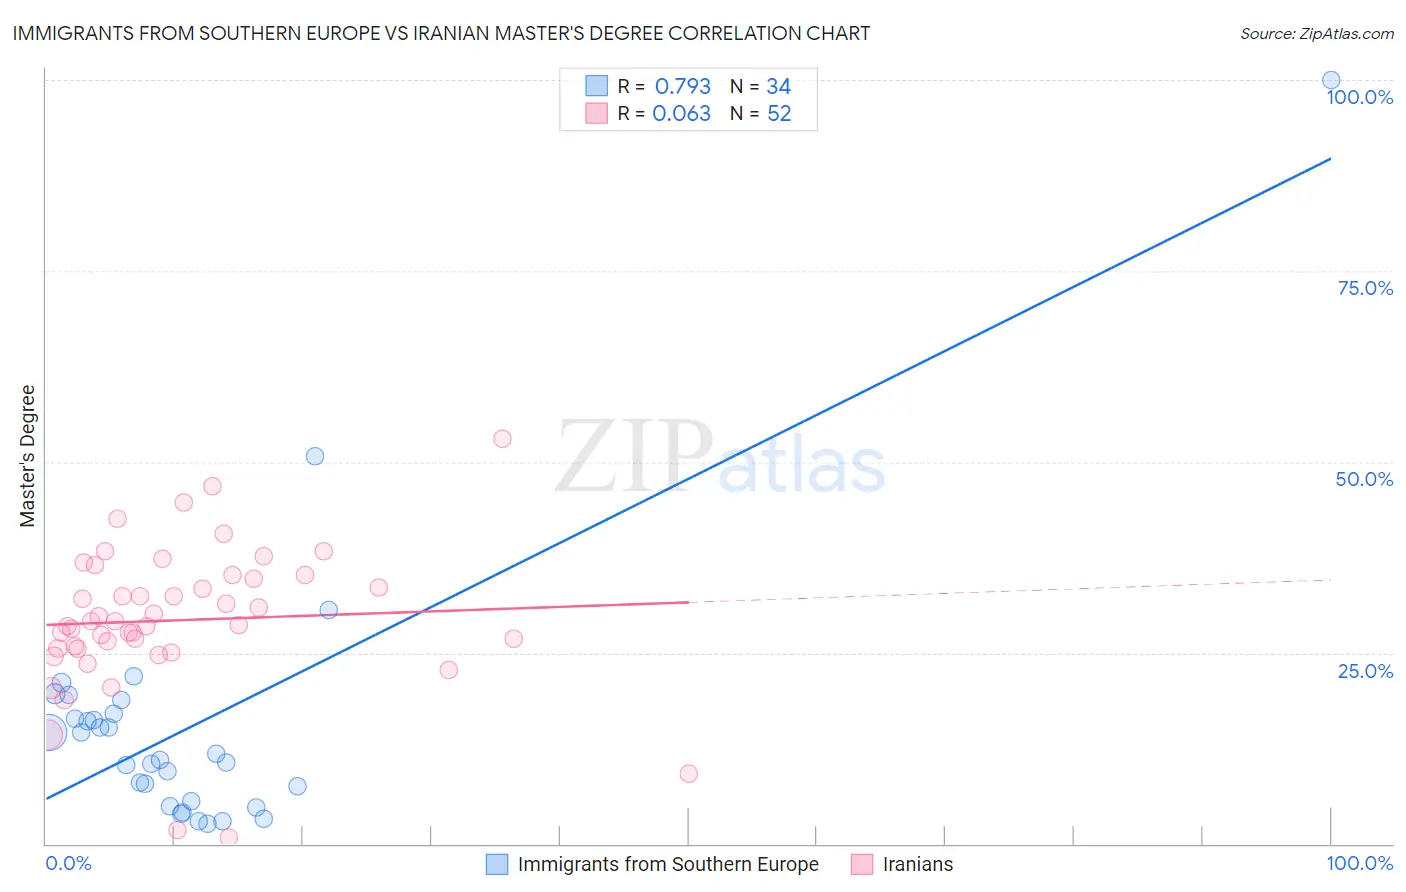
Immigrants from Southern Europe vs Iranian Master's Degree Correlation Chart
The statistical analysis conducted on geographies consisting of 402,732,605 people shows a strong positive correlation between the proportion of Immigrants from Southern Europe and percentage of population with at least master's degree education in the United States with a correlation coefficient (R) of 0.793 and weighted average of 16.6%. Similarly, the statistical analysis conducted on geographies consisting of 316,817,608 people shows a slight positive correlation between the proportion of Iranians and percentage of population with at least master's degree education in the United States with a correlation coefficient (R) of 0.063 and weighted average of 22.3%, a difference of 34.0%.
Master's Degree Correlation Summary
| Measurement | Immigrants from Southern Europe | Iranian |
| Minimum | 2.6% | 0.89% |
| Maximum | 100.0% | 53.0% |
| Range | 97.4% | 52.1% |
| Mean | 15.6% | 29.3% |
| Median | 11.4% | 28.9% |
| Interquartile 25% (IQ1) | 5.6% | 25.5% |
| Interquartile 75% (IQ3) | 17.0% | 34.9% |
| Interquartile Range (IQR) | 11.3% | 9.4% |
| Standard Deviation (Sample) | 17.6% | 9.6% |
| Standard Deviation (Population) | 17.4% | 9.5% |
Similar Demographics by Master's Degree
Demographics Similar to Immigrants from Southern Europe by Master's Degree
In terms of master's degree, the demographic groups most similar to Immigrants from Southern Europe are Immigrants from Moldova (16.6%, a difference of 0.010%), Immigrants from Uganda (16.6%, a difference of 0.12%), Northern European (16.7%, a difference of 0.42%), Brazilian (16.5%, a difference of 0.43%), and Arab (16.7%, a difference of 0.49%).
| Demographics | Rating | Rank | Master's Degree |
| Moroccans | 98.0 /100 | #109 | Exceptional 16.8% |
| Immigrants | Chile | 98.0 /100 | #110 | Exceptional 16.8% |
| Austrians | 97.8 /100 | #111 | Exceptional 16.7% |
| Macedonians | 97.7 /100 | #112 | Exceptional 16.7% |
| Arabs | 97.7 /100 | #113 | Exceptional 16.7% |
| Northern Europeans | 97.6 /100 | #114 | Exceptional 16.7% |
| Immigrants | Uganda | 97.3 /100 | #115 | Exceptional 16.6% |
| Immigrants | Southern Europe | 97.2 /100 | #116 | Exceptional 16.6% |
| Immigrants | Moldova | 97.2 /100 | #117 | Exceptional 16.6% |
| Brazilians | 96.8 /100 | #118 | Exceptional 16.5% |
| Jordanians | 96.5 /100 | #119 | Exceptional 16.5% |
| Lebanese | 96.4 /100 | #120 | Exceptional 16.5% |
| Afghans | 96.2 /100 | #121 | Exceptional 16.5% |
| British | 95.6 /100 | #122 | Exceptional 16.4% |
| Croatians | 95.6 /100 | #123 | Exceptional 16.4% |
Demographics Similar to Iranians by Master's Degree
In terms of master's degree, the demographic groups most similar to Iranians are Immigrants from India (22.3%, a difference of 0.21%), Immigrants from Taiwan (22.5%, a difference of 0.88%), Immigrants from Israel (22.6%, a difference of 1.7%), Okinawan (22.6%, a difference of 1.7%), and Cypriot (21.8%, a difference of 2.2%).
| Demographics | Rating | Rank | Master's Degree |
| Immigrants | Singapore | 100.0 /100 | #1 | Exceptional 23.4% |
| Filipinos | 100.0 /100 | #2 | Exceptional 23.4% |
| Immigrants | Israel | 100.0 /100 | #3 | Exceptional 22.6% |
| Okinawans | 100.0 /100 | #4 | Exceptional 22.6% |
| Immigrants | Taiwan | 100.0 /100 | #5 | Exceptional 22.5% |
| Immigrants | India | 100.0 /100 | #6 | Exceptional 22.3% |
| Iranians | 100.0 /100 | #7 | Exceptional 22.3% |
| Cypriots | 100.0 /100 | #8 | Exceptional 21.8% |
| Thais | 100.0 /100 | #9 | Exceptional 21.7% |
| Immigrants | Iran | 100.0 /100 | #10 | Exceptional 21.6% |
| Immigrants | China | 100.0 /100 | #11 | Exceptional 21.2% |
| Eastern Europeans | 100.0 /100 | #12 | Exceptional 21.1% |
| Immigrants | Australia | 100.0 /100 | #13 | Exceptional 20.9% |
| Immigrants | Switzerland | 100.0 /100 | #14 | Exceptional 20.9% |
| Immigrants | Eastern Asia | 100.0 /100 | #15 | Exceptional 20.8% |