Sioux vs Iranian Master's Degree
COMPARE
Sioux
Iranian
Master's Degree
Master's Degree Comparison
Sioux
Iranians
10.7%
MASTER'S DEGREE
0.0/ 100
METRIC RATING
322nd/ 347
METRIC RANK
22.3%
MASTER'S DEGREE
100.0/ 100
METRIC RATING
7th/ 347
METRIC RANK
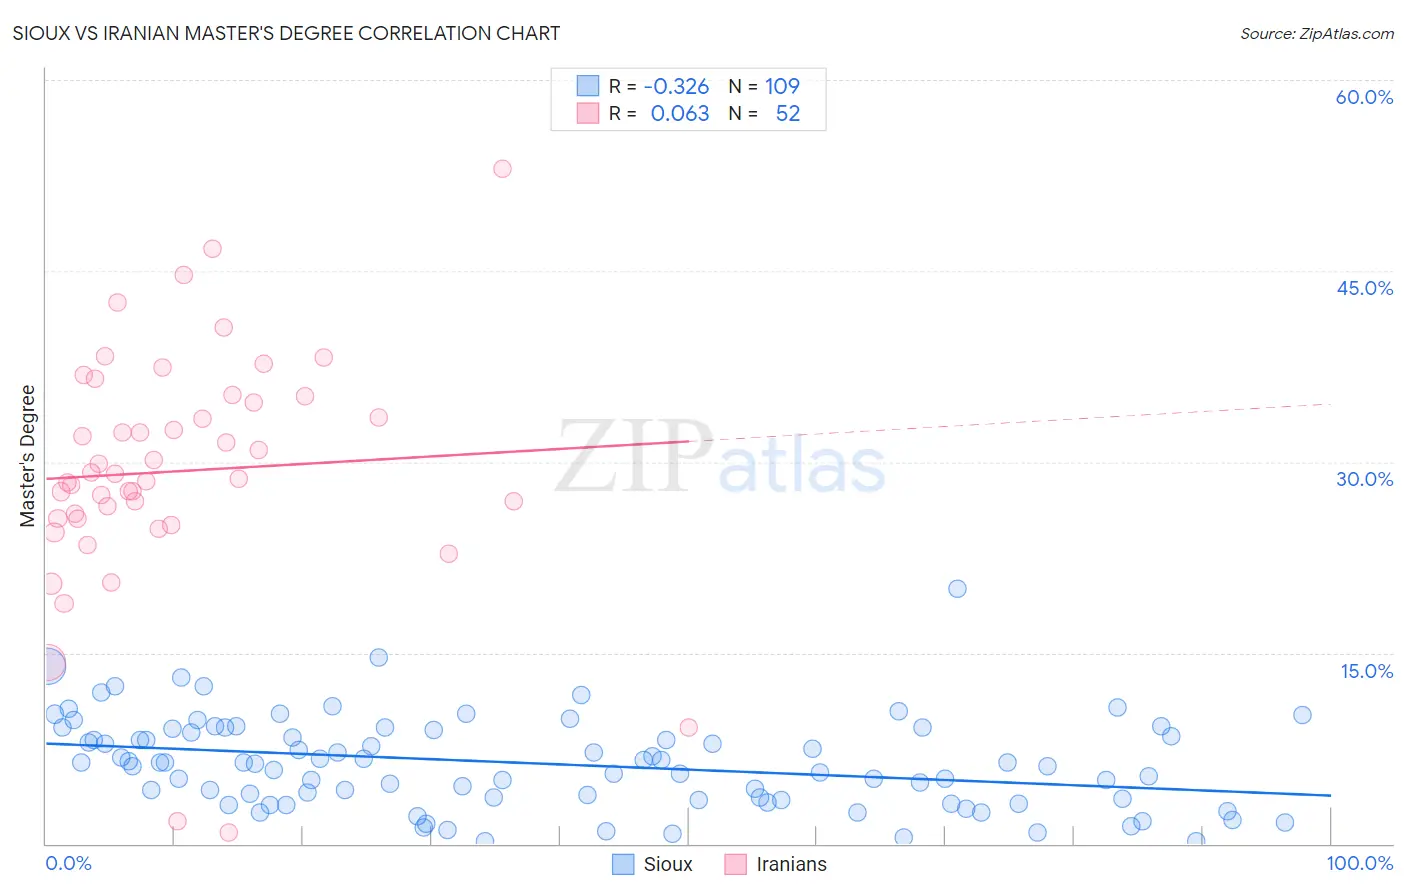
Sioux vs Iranian Master's Degree Correlation Chart
The statistical analysis conducted on geographies consisting of 234,105,969 people shows a mild negative correlation between the proportion of Sioux and percentage of population with at least master's degree education in the United States with a correlation coefficient (R) of -0.326 and weighted average of 10.7%. Similarly, the statistical analysis conducted on geographies consisting of 316,817,608 people shows a slight positive correlation between the proportion of Iranians and percentage of population with at least master's degree education in the United States with a correlation coefficient (R) of 0.063 and weighted average of 22.3%, a difference of 108.6%.
Master's Degree Correlation Summary
| Measurement | Sioux | Iranian |
| Minimum | 0.18% | 0.89% |
| Maximum | 20.0% | 53.0% |
| Range | 19.8% | 52.1% |
| Mean | 6.3% | 29.3% |
| Median | 6.4% | 28.9% |
| Interquartile 25% (IQ1) | 3.5% | 25.5% |
| Interquartile 75% (IQ3) | 9.0% | 34.9% |
| Interquartile Range (IQR) | 5.5% | 9.4% |
| Standard Deviation (Sample) | 3.6% | 9.6% |
| Standard Deviation (Population) | 3.6% | 9.5% |
Similar Demographics by Master's Degree
Demographics Similar to Sioux by Master's Degree
In terms of master's degree, the demographic groups most similar to Sioux are Crow (10.6%, a difference of 0.39%), Dutch West Indian (10.6%, a difference of 0.44%), Pennsylvania German (10.7%, a difference of 0.64%), Immigrants from Micronesia (10.8%, a difference of 0.85%), and Kiowa (10.8%, a difference of 1.5%).
| Demographics | Rating | Rank | Master's Degree |
| Apache | 0.0 /100 | #315 | Tragic 11.0% |
| Hispanics or Latinos | 0.0 /100 | #316 | Tragic 10.9% |
| Hopi | 0.0 /100 | #317 | Tragic 10.9% |
| Immigrants | Cuba | 0.0 /100 | #318 | Tragic 10.9% |
| Kiowa | 0.0 /100 | #319 | Tragic 10.8% |
| Immigrants | Micronesia | 0.0 /100 | #320 | Tragic 10.8% |
| Pennsylvania Germans | 0.0 /100 | #321 | Tragic 10.7% |
| Sioux | 0.0 /100 | #322 | Tragic 10.7% |
| Crow | 0.0 /100 | #323 | Tragic 10.6% |
| Dutch West Indians | 0.0 /100 | #324 | Tragic 10.6% |
| Inupiat | 0.0 /100 | #325 | Tragic 10.5% |
| Creek | 0.0 /100 | #326 | Tragic 10.5% |
| Paiute | 0.0 /100 | #327 | Tragic 10.5% |
| Bangladeshis | 0.0 /100 | #328 | Tragic 10.5% |
| Nepalese | 0.0 /100 | #329 | Tragic 10.5% |
Demographics Similar to Iranians by Master's Degree
In terms of master's degree, the demographic groups most similar to Iranians are Immigrants from India (22.3%, a difference of 0.21%), Immigrants from Taiwan (22.5%, a difference of 0.88%), Immigrants from Israel (22.6%, a difference of 1.7%), Okinawan (22.6%, a difference of 1.7%), and Cypriot (21.8%, a difference of 2.2%).
| Demographics | Rating | Rank | Master's Degree |
| Immigrants | Singapore | 100.0 /100 | #1 | Exceptional 23.4% |
| Filipinos | 100.0 /100 | #2 | Exceptional 23.4% |
| Immigrants | Israel | 100.0 /100 | #3 | Exceptional 22.6% |
| Okinawans | 100.0 /100 | #4 | Exceptional 22.6% |
| Immigrants | Taiwan | 100.0 /100 | #5 | Exceptional 22.5% |
| Immigrants | India | 100.0 /100 | #6 | Exceptional 22.3% |
| Iranians | 100.0 /100 | #7 | Exceptional 22.3% |
| Cypriots | 100.0 /100 | #8 | Exceptional 21.8% |
| Thais | 100.0 /100 | #9 | Exceptional 21.7% |
| Immigrants | Iran | 100.0 /100 | #10 | Exceptional 21.6% |
| Immigrants | China | 100.0 /100 | #11 | Exceptional 21.2% |
| Eastern Europeans | 100.0 /100 | #12 | Exceptional 21.1% |
| Immigrants | Australia | 100.0 /100 | #13 | Exceptional 20.9% |
| Immigrants | Switzerland | 100.0 /100 | #14 | Exceptional 20.9% |
| Immigrants | Eastern Asia | 100.0 /100 | #15 | Exceptional 20.8% |