Immigrants from Romania vs Austrian Master's Degree
COMPARE
Immigrants from Romania
Austrian
Master's Degree
Master's Degree Comparison
Immigrants from Romania
Austrians
17.7%
MASTER'S DEGREE
99.7/ 100
METRIC RATING
74th/ 347
METRIC RANK
16.7%
MASTER'S DEGREE
97.8/ 100
METRIC RATING
111th/ 347
METRIC RANK
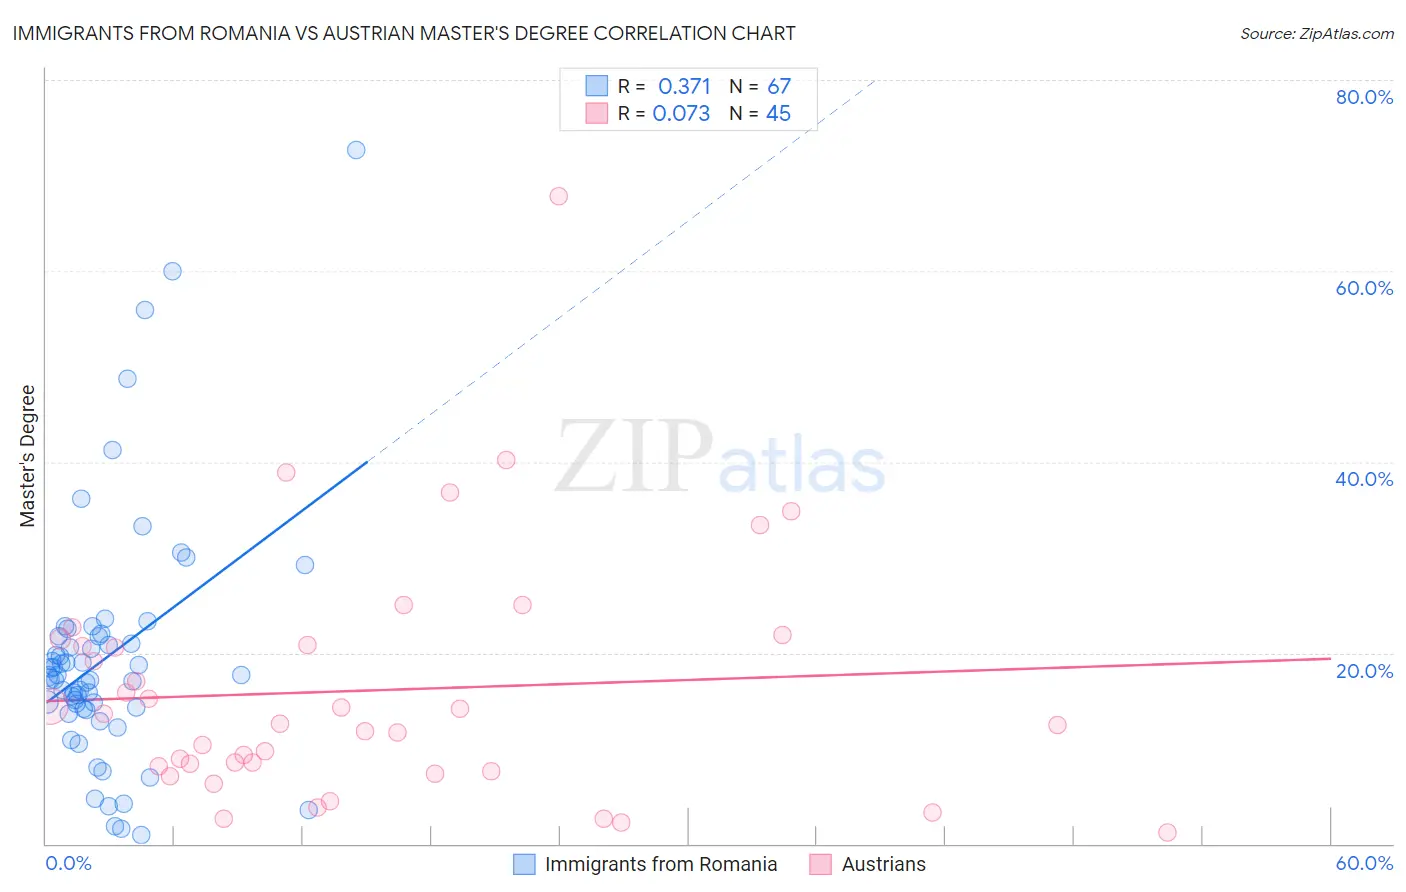
Immigrants from Romania vs Austrian Master's Degree Correlation Chart
The statistical analysis conducted on geographies consisting of 256,994,499 people shows a mild positive correlation between the proportion of Immigrants from Romania and percentage of population with at least master's degree education in the United States with a correlation coefficient (R) of 0.371 and weighted average of 17.7%. Similarly, the statistical analysis conducted on geographies consisting of 451,930,170 people shows a slight positive correlation between the proportion of Austrians and percentage of population with at least master's degree education in the United States with a correlation coefficient (R) of 0.073 and weighted average of 16.7%, a difference of 5.6%.
Master's Degree Correlation Summary
| Measurement | Immigrants from Romania | Austrian |
| Minimum | 0.91% | 1.2% |
| Maximum | 72.6% | 67.9% |
| Range | 71.7% | 66.7% |
| Mean | 19.6% | 16.1% |
| Median | 17.5% | 12.6% |
| Interquartile 25% (IQ1) | 14.1% | 7.9% |
| Interquartile 75% (IQ3) | 21.8% | 21.1% |
| Interquartile Range (IQR) | 7.7% | 13.2% |
| Standard Deviation (Sample) | 12.9% | 12.8% |
| Standard Deviation (Population) | 12.8% | 12.7% |
Similar Demographics by Master's Degree
Demographics Similar to Immigrants from Romania by Master's Degree
In terms of master's degree, the demographic groups most similar to Immigrants from Romania are Zimbabwean (17.7%, a difference of 0.31%), Egyptian (17.6%, a difference of 0.38%), Immigrants from Indonesia (17.6%, a difference of 0.40%), Lithuanian (17.7%, a difference of 0.41%), and Immigrants from Eastern Europe (17.6%, a difference of 0.52%).
| Demographics | Rating | Rank | Master's Degree |
| Immigrants | Argentina | 99.8 /100 | #67 | Exceptional 18.0% |
| Immigrants | Ethiopia | 99.8 /100 | #68 | Exceptional 17.9% |
| Immigrants | Uzbekistan | 99.8 /100 | #69 | Exceptional 17.9% |
| Immigrants | Western Europe | 99.8 /100 | #70 | Exceptional 17.8% |
| Immigrants | Pakistan | 99.7 /100 | #71 | Exceptional 17.8% |
| Lithuanians | 99.7 /100 | #72 | Exceptional 17.7% |
| Zimbabweans | 99.7 /100 | #73 | Exceptional 17.7% |
| Immigrants | Romania | 99.7 /100 | #74 | Exceptional 17.7% |
| Egyptians | 99.6 /100 | #75 | Exceptional 17.6% |
| Immigrants | Indonesia | 99.6 /100 | #76 | Exceptional 17.6% |
| Immigrants | Eastern Europe | 99.6 /100 | #77 | Exceptional 17.6% |
| Immigrants | Hungary | 99.6 /100 | #78 | Exceptional 17.5% |
| Immigrants | Lebanon | 99.6 /100 | #79 | Exceptional 17.5% |
| Carpatho Rusyns | 99.6 /100 | #80 | Exceptional 17.5% |
| Immigrants | Western Asia | 99.5 /100 | #81 | Exceptional 17.5% |
Demographics Similar to Austrians by Master's Degree
In terms of master's degree, the demographic groups most similar to Austrians are Macedonian (16.7%, a difference of 0.14%), Arab (16.7%, a difference of 0.15%), Northern European (16.7%, a difference of 0.22%), Immigrants from Chile (16.8%, a difference of 0.27%), and Moroccan (16.8%, a difference of 0.30%).
| Demographics | Rating | Rank | Master's Degree |
| Ukrainians | 98.3 /100 | #104 | Exceptional 16.9% |
| Syrians | 98.3 /100 | #105 | Exceptional 16.8% |
| Immigrants | Albania | 98.1 /100 | #106 | Exceptional 16.8% |
| Armenians | 98.0 /100 | #107 | Exceptional 16.8% |
| Sierra Leoneans | 98.0 /100 | #108 | Exceptional 16.8% |
| Moroccans | 98.0 /100 | #109 | Exceptional 16.8% |
| Immigrants | Chile | 98.0 /100 | #110 | Exceptional 16.8% |
| Austrians | 97.8 /100 | #111 | Exceptional 16.7% |
| Macedonians | 97.7 /100 | #112 | Exceptional 16.7% |
| Arabs | 97.7 /100 | #113 | Exceptional 16.7% |
| Northern Europeans | 97.6 /100 | #114 | Exceptional 16.7% |
| Immigrants | Uganda | 97.3 /100 | #115 | Exceptional 16.6% |
| Immigrants | Southern Europe | 97.2 /100 | #116 | Exceptional 16.6% |
| Immigrants | Moldova | 97.2 /100 | #117 | Exceptional 16.6% |
| Brazilians | 96.8 /100 | #118 | Exceptional 16.5% |