Czech vs Austrian Master's Degree
COMPARE
Czech
Austrian
Master's Degree
Master's Degree Comparison
Czechs
Austrians
14.7%
MASTER'S DEGREE
40.4/ 100
METRIC RATING
182nd/ 347
METRIC RANK
16.7%
MASTER'S DEGREE
97.8/ 100
METRIC RATING
111th/ 347
METRIC RANK
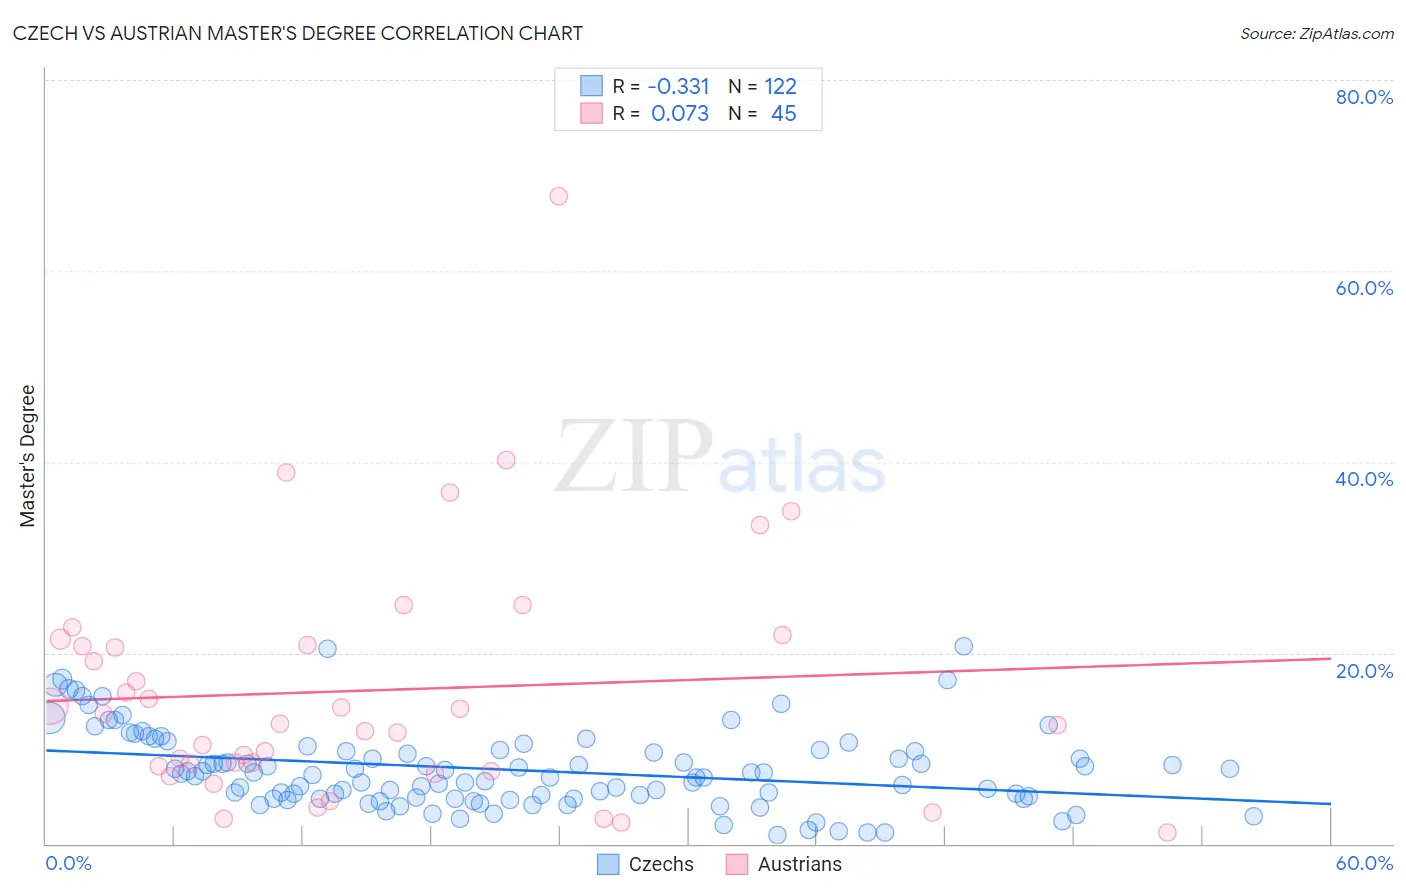
Czech vs Austrian Master's Degree Correlation Chart
The statistical analysis conducted on geographies consisting of 484,547,071 people shows a mild negative correlation between the proportion of Czechs and percentage of population with at least master's degree education in the United States with a correlation coefficient (R) of -0.331 and weighted average of 14.7%. Similarly, the statistical analysis conducted on geographies consisting of 451,930,170 people shows a slight positive correlation between the proportion of Austrians and percentage of population with at least master's degree education in the United States with a correlation coefficient (R) of 0.073 and weighted average of 16.7%, a difference of 13.5%.
Master's Degree Correlation Summary
| Measurement | Czech | Austrian |
| Minimum | 0.93% | 1.2% |
| Maximum | 20.7% | 67.9% |
| Range | 19.8% | 66.7% |
| Mean | 7.8% | 16.1% |
| Median | 7.2% | 12.6% |
| Interquartile 25% (IQ1) | 4.7% | 7.9% |
| Interquartile 75% (IQ3) | 9.9% | 21.1% |
| Interquartile Range (IQR) | 5.1% | 13.2% |
| Standard Deviation (Sample) | 4.1% | 12.8% |
| Standard Deviation (Population) | 4.1% | 12.7% |
Similar Demographics by Master's Degree
Demographics Similar to Czechs by Master's Degree
In terms of master's degree, the demographic groups most similar to Czechs are Swiss (14.7%, a difference of 0.10%), Sri Lankan (14.7%, a difference of 0.10%), Celtic (14.8%, a difference of 0.12%), Immigrants from Zaire (14.7%, a difference of 0.12%), and Immigrants from Iraq (14.8%, a difference of 0.13%).
| Demographics | Rating | Rank | Master's Degree |
| Immigrants | Peru | 49.6 /100 | #175 | Average 14.9% |
| Nigerians | 48.6 /100 | #176 | Average 14.9% |
| Immigrants | Colombia | 48.3 /100 | #177 | Average 14.9% |
| English | 45.0 /100 | #178 | Average 14.8% |
| Immigrants | Iraq | 41.3 /100 | #179 | Average 14.8% |
| Celtics | 41.3 /100 | #180 | Average 14.8% |
| Swiss | 41.1 /100 | #181 | Average 14.7% |
| Czechs | 40.4 /100 | #182 | Average 14.7% |
| Sri Lankans | 39.6 /100 | #183 | Fair 14.7% |
| Immigrants | Zaire | 39.5 /100 | #184 | Fair 14.7% |
| Barbadians | 38.3 /100 | #185 | Fair 14.7% |
| Immigrants | Oceania | 37.1 /100 | #186 | Fair 14.7% |
| Basques | 36.5 /100 | #187 | Fair 14.7% |
| Immigrants | Costa Rica | 36.2 /100 | #188 | Fair 14.7% |
| Immigrants | Immigrants | 36.0 /100 | #189 | Fair 14.6% |
Demographics Similar to Austrians by Master's Degree
In terms of master's degree, the demographic groups most similar to Austrians are Macedonian (16.7%, a difference of 0.14%), Arab (16.7%, a difference of 0.15%), Northern European (16.7%, a difference of 0.22%), Immigrants from Chile (16.8%, a difference of 0.27%), and Moroccan (16.8%, a difference of 0.30%).
| Demographics | Rating | Rank | Master's Degree |
| Ukrainians | 98.3 /100 | #104 | Exceptional 16.9% |
| Syrians | 98.3 /100 | #105 | Exceptional 16.8% |
| Immigrants | Albania | 98.1 /100 | #106 | Exceptional 16.8% |
| Armenians | 98.0 /100 | #107 | Exceptional 16.8% |
| Sierra Leoneans | 98.0 /100 | #108 | Exceptional 16.8% |
| Moroccans | 98.0 /100 | #109 | Exceptional 16.8% |
| Immigrants | Chile | 98.0 /100 | #110 | Exceptional 16.8% |
| Austrians | 97.8 /100 | #111 | Exceptional 16.7% |
| Macedonians | 97.7 /100 | #112 | Exceptional 16.7% |
| Arabs | 97.7 /100 | #113 | Exceptional 16.7% |
| Northern Europeans | 97.6 /100 | #114 | Exceptional 16.7% |
| Immigrants | Uganda | 97.3 /100 | #115 | Exceptional 16.6% |
| Immigrants | Southern Europe | 97.2 /100 | #116 | Exceptional 16.6% |
| Immigrants | Moldova | 97.2 /100 | #117 | Exceptional 16.6% |
| Brazilians | 96.8 /100 | #118 | Exceptional 16.5% |