Marshallese vs Macedonian 2nd Grade
COMPARE
Marshallese
Macedonian
2nd Grade
2nd Grade Comparison
Marshallese
Macedonians
97.9%
2ND GRADE
67.7/ 100
METRIC RATING
154th/ 347
METRIC RANK
98.2%
2ND GRADE
99.0/ 100
METRIC RATING
88th/ 347
METRIC RANK
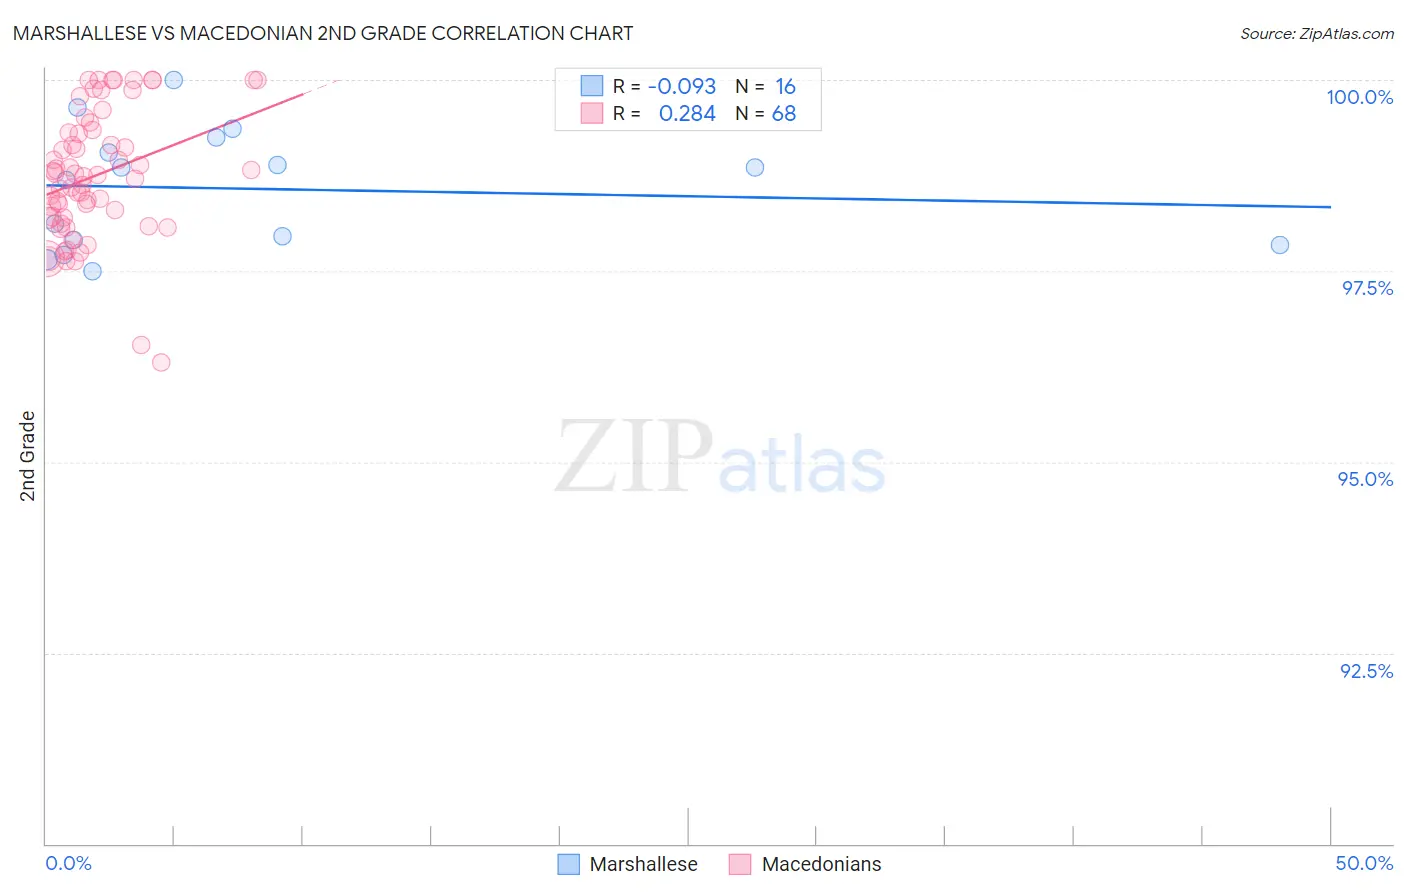
Marshallese vs Macedonian 2nd Grade Correlation Chart
The statistical analysis conducted on geographies consisting of 14,761,315 people shows a slight negative correlation between the proportion of Marshallese and percentage of population with at least 2nd grade education in the United States with a correlation coefficient (R) of -0.093 and weighted average of 97.9%. Similarly, the statistical analysis conducted on geographies consisting of 132,592,860 people shows a weak positive correlation between the proportion of Macedonians and percentage of population with at least 2nd grade education in the United States with a correlation coefficient (R) of 0.284 and weighted average of 98.2%, a difference of 0.30%.
2nd Grade Correlation Summary
| Measurement | Marshallese | Macedonian |
| Minimum | 97.5% | 96.3% |
| Maximum | 100.0% | 100.0% |
| Range | 2.5% | 3.7% |
| Mean | 98.6% | 98.7% |
| Median | 98.8% | 98.8% |
| Interquartile 25% (IQ1) | 97.9% | 98.2% |
| Interquartile 75% (IQ3) | 99.1% | 99.3% |
| Interquartile Range (IQR) | 1.3% | 1.1% |
| Standard Deviation (Sample) | 0.78% | 0.84% |
| Standard Deviation (Population) | 0.75% | 0.83% |
Similar Demographics by 2nd Grade
Demographics Similar to Marshallese by 2nd Grade
In terms of 2nd grade, the demographic groups most similar to Marshallese are Immigrants from North Macedonia (97.9%, a difference of 0.0%), Immigrants from South Central Asia (97.9%, a difference of 0.0%), Soviet Union (97.9%, a difference of 0.010%), French American Indian (97.9%, a difference of 0.010%), and Dutch West Indian (97.9%, a difference of 0.010%).
| Demographics | Rating | Rank | 2nd Grade |
| Immigrants | Greece | 76.8 /100 | #147 | Good 98.0% |
| Jordanians | 74.5 /100 | #148 | Good 98.0% |
| Apache | 74.0 /100 | #149 | Good 97.9% |
| Immigrants | Moldova | 72.9 /100 | #150 | Good 97.9% |
| Soviet Union | 70.7 /100 | #151 | Good 97.9% |
| Immigrants | North Macedonia | 68.5 /100 | #152 | Good 97.9% |
| Immigrants | South Central Asia | 68.3 /100 | #153 | Good 97.9% |
| Marshallese | 67.7 /100 | #154 | Good 97.9% |
| French American Indians | 64.3 /100 | #155 | Good 97.9% |
| Dutch West Indians | 63.8 /100 | #156 | Good 97.9% |
| Venezuelans | 63.3 /100 | #157 | Good 97.9% |
| Immigrants | Iran | 62.8 /100 | #158 | Good 97.9% |
| Comanche | 62.8 /100 | #159 | Good 97.9% |
| Immigrants | Eastern Europe | 61.1 /100 | #160 | Good 97.9% |
| Immigrants | Russia | 60.3 /100 | #161 | Good 97.9% |
Demographics Similar to Macedonians by 2nd Grade
In terms of 2nd grade, the demographic groups most similar to Macedonians are Immigrants from Australia (98.2%, a difference of 0.0%), Immigrants from Denmark (98.2%, a difference of 0.0%), Ukrainian (98.2%, a difference of 0.0%), Delaware (98.2%, a difference of 0.010%), and Immigrants from Sweden (98.2%, a difference of 0.010%).
| Demographics | Rating | Rank | 2nd Grade |
| Icelanders | 99.2 /100 | #81 | Exceptional 98.2% |
| Delaware | 99.1 /100 | #82 | Exceptional 98.2% |
| Immigrants | Sweden | 99.1 /100 | #83 | Exceptional 98.2% |
| Hopi | 99.1 /100 | #84 | Exceptional 98.2% |
| Potawatomi | 99.1 /100 | #85 | Exceptional 98.2% |
| Immigrants | Australia | 99.0 /100 | #86 | Exceptional 98.2% |
| Immigrants | Denmark | 99.0 /100 | #87 | Exceptional 98.2% |
| Macedonians | 99.0 /100 | #88 | Exceptional 98.2% |
| Ukrainians | 98.9 /100 | #89 | Exceptional 98.2% |
| Zimbabweans | 98.8 /100 | #90 | Exceptional 98.2% |
| Immigrants | Western Europe | 98.8 /100 | #91 | Exceptional 98.2% |
| Immigrants | South Africa | 98.8 /100 | #92 | Exceptional 98.2% |
| Immigrants | India | 98.8 /100 | #93 | Exceptional 98.2% |
| Immigrants | Germany | 98.6 /100 | #94 | Exceptional 98.2% |
| South Africans | 98.6 /100 | #95 | Exceptional 98.2% |