Asian vs Immigrants from Ecuador 2nd Grade
COMPARE
Asian
Immigrants from Ecuador
2nd Grade
2nd Grade Comparison
Asians
Immigrants from Ecuador
97.5%
2ND GRADE
1.1/ 100
METRIC RATING
243rd/ 347
METRIC RANK
96.8%
2ND GRADE
0.0/ 100
METRIC RATING
314th/ 347
METRIC RANK
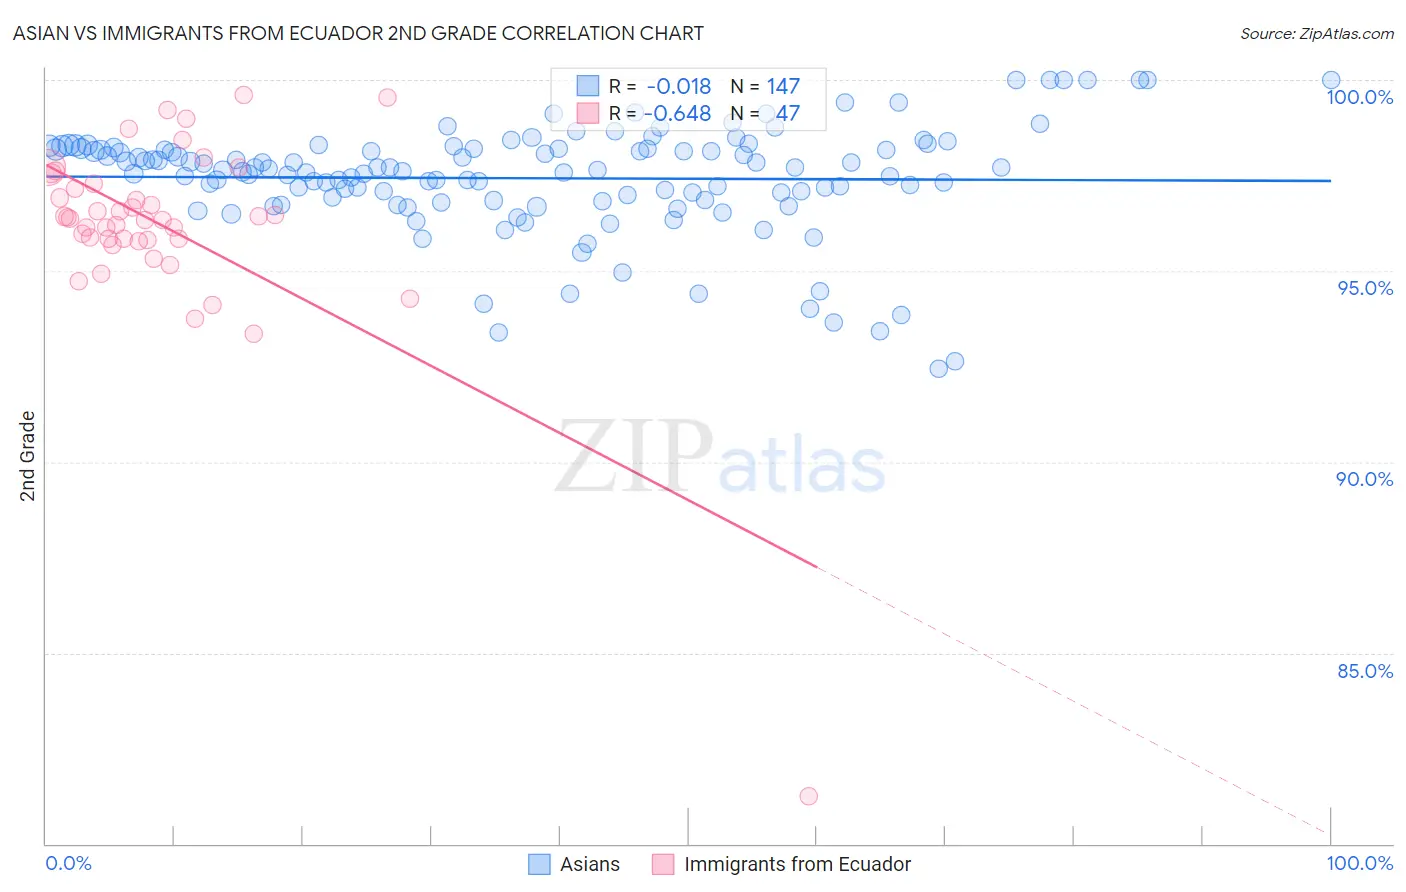
Asian vs Immigrants from Ecuador 2nd Grade Correlation Chart
The statistical analysis conducted on geographies consisting of 550,722,447 people shows no correlation between the proportion of Asians and percentage of population with at least 2nd grade education in the United States with a correlation coefficient (R) of -0.018 and weighted average of 97.5%. Similarly, the statistical analysis conducted on geographies consisting of 271,020,679 people shows a significant negative correlation between the proportion of Immigrants from Ecuador and percentage of population with at least 2nd grade education in the United States with a correlation coefficient (R) of -0.648 and weighted average of 96.8%, a difference of 0.78%.
2nd Grade Correlation Summary
| Measurement | Asian | Immigrants from Ecuador |
| Minimum | 92.4% | 81.2% |
| Maximum | 100.0% | 99.6% |
| Range | 7.6% | 18.3% |
| Mean | 97.4% | 96.2% |
| Median | 97.6% | 96.4% |
| Interquartile 25% (IQ1) | 96.9% | 95.8% |
| Interquartile 75% (IQ3) | 98.2% | 97.3% |
| Interquartile Range (IQR) | 1.3% | 1.5% |
| Standard Deviation (Sample) | 1.4% | 2.6% |
| Standard Deviation (Population) | 1.4% | 2.6% |
Similar Demographics by 2nd Grade
Demographics Similar to Asians by 2nd Grade
In terms of 2nd grade, the demographic groups most similar to Asians are Ethiopian (97.5%, a difference of 0.010%), Immigrants from Indonesia (97.5%, a difference of 0.010%), Immigrants from Iraq (97.5%, a difference of 0.010%), Immigrants from Eastern Africa (97.5%, a difference of 0.010%), and Korean (97.5%, a difference of 0.020%).
| Demographics | Rating | Rank | 2nd Grade |
| Nigerians | 1.7 /100 | #236 | Tragic 97.6% |
| U.S. Virgin Islanders | 1.6 /100 | #237 | Tragic 97.6% |
| Immigrants | Eastern Asia | 1.6 /100 | #238 | Tragic 97.6% |
| Liberians | 1.6 /100 | #239 | Tragic 97.6% |
| Koreans | 1.5 /100 | #240 | Tragic 97.5% |
| Ethiopians | 1.2 /100 | #241 | Tragic 97.5% |
| Immigrants | Indonesia | 1.2 /100 | #242 | Tragic 97.5% |
| Asians | 1.1 /100 | #243 | Tragic 97.5% |
| Immigrants | Iraq | 1.0 /100 | #244 | Tragic 97.5% |
| Immigrants | Eastern Africa | 0.9 /100 | #245 | Tragic 97.5% |
| South Americans | 0.9 /100 | #246 | Tragic 97.5% |
| Immigrants | Senegal | 0.9 /100 | #247 | Tragic 97.5% |
| Immigrants | Middle Africa | 0.9 /100 | #248 | Tragic 97.5% |
| Bolivians | 0.9 /100 | #249 | Tragic 97.5% |
| Peruvians | 0.9 /100 | #250 | Tragic 97.5% |
Demographics Similar to Immigrants from Ecuador by 2nd Grade
In terms of 2nd grade, the demographic groups most similar to Immigrants from Ecuador are Immigrants from Belize (96.8%, a difference of 0.020%), Hispanic or Latino (96.8%, a difference of 0.030%), Honduran (96.7%, a difference of 0.030%), Immigrants from Laos (96.7%, a difference of 0.030%), and Indonesian (96.7%, a difference of 0.030%).
| Demographics | Rating | Rank | 2nd Grade |
| Immigrants | Azores | 0.0 /100 | #307 | Tragic 96.8% |
| Immigrants | Haiti | 0.0 /100 | #308 | Tragic 96.8% |
| Belizeans | 0.0 /100 | #309 | Tragic 96.8% |
| Sri Lankans | 0.0 /100 | #310 | Tragic 96.8% |
| Guyanese | 0.0 /100 | #311 | Tragic 96.8% |
| Cape Verdeans | 0.0 /100 | #312 | Tragic 96.8% |
| Hispanics or Latinos | 0.0 /100 | #313 | Tragic 96.8% |
| Immigrants | Ecuador | 0.0 /100 | #314 | Tragic 96.8% |
| Immigrants | Belize | 0.0 /100 | #315 | Tragic 96.8% |
| Hondurans | 0.0 /100 | #316 | Tragic 96.7% |
| Immigrants | Laos | 0.0 /100 | #317 | Tragic 96.7% |
| Indonesians | 0.0 /100 | #318 | Tragic 96.7% |
| Immigrants | Nicaragua | 0.0 /100 | #319 | Tragic 96.7% |
| Immigrants | Guyana | 0.0 /100 | #320 | Tragic 96.7% |
| Immigrants | Burma/Myanmar | 0.0 /100 | #321 | Tragic 96.7% |