Immigrants from Spain vs Immigrants from Iran 7th Grade
COMPARE
Immigrants from Spain
Immigrants from Iran
7th Grade
7th Grade Comparison
Immigrants from Spain
Immigrants from Iran
96.0%
7TH GRADE
38.8/ 100
METRIC RATING
183rd/ 347
METRIC RANK
96.0%
7TH GRADE
47.8/ 100
METRIC RATING
179th/ 347
METRIC RANK
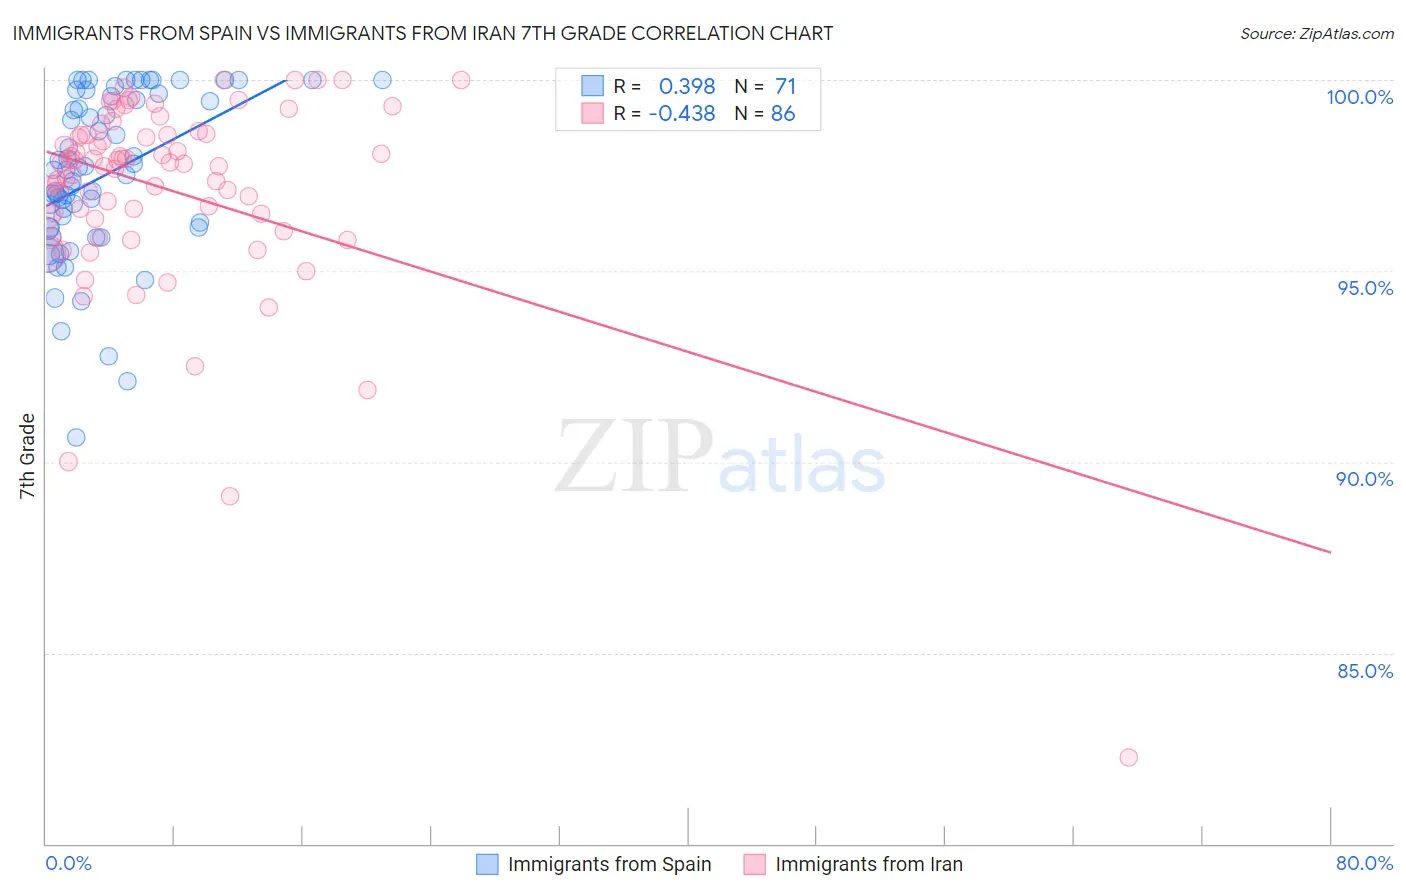
Immigrants from Spain vs Immigrants from Iran 7th Grade Correlation Chart
The statistical analysis conducted on geographies consisting of 239,679,924 people shows a mild positive correlation between the proportion of Immigrants from Spain and percentage of population with at least 7th grade education in the United States with a correlation coefficient (R) of 0.398 and weighted average of 96.0%. Similarly, the statistical analysis conducted on geographies consisting of 279,867,553 people shows a moderate negative correlation between the proportion of Immigrants from Iran and percentage of population with at least 7th grade education in the United States with a correlation coefficient (R) of -0.438 and weighted average of 96.0%, a difference of 0.060%.
7th Grade Correlation Summary
| Measurement | Immigrants from Spain | Immigrants from Iran |
| Minimum | 90.6% | 82.3% |
| Maximum | 100.0% | 100.0% |
| Range | 9.4% | 17.7% |
| Mean | 97.5% | 97.1% |
| Median | 97.6% | 97.8% |
| Interquartile 25% (IQ1) | 96.1% | 96.4% |
| Interquartile 75% (IQ3) | 99.6% | 98.6% |
| Interquartile Range (IQR) | 3.4% | 2.1% |
| Standard Deviation (Sample) | 2.1% | 2.6% |
| Standard Deviation (Population) | 2.1% | 2.6% |
Demographics Similar to Immigrants from Spain and Immigrants from Iran by 7th Grade
In terms of 7th grade, the demographic groups most similar to Immigrants from Spain are Sierra Leonean (96.0%, a difference of 0.010%), Brazilian (96.0%, a difference of 0.010%), Iraqi (96.0%, a difference of 0.020%), Immigrants from Iraq (96.0%, a difference of 0.020%), and Immigrants from Uganda (96.0%, a difference of 0.020%). Similarly, the demographic groups most similar to Immigrants from Iran are Marshallese (96.0%, a difference of 0.0%), Mongolian (96.0%, a difference of 0.010%), Black/African American (96.0%, a difference of 0.010%), Chilean (96.0%, a difference of 0.010%), and Immigrants from Korea (96.0%, a difference of 0.010%).
| Demographics | Rating | Rank | 7th Grade |
| Egyptians | 54.2 /100 | #171 | Average 96.1% |
| Venezuelans | 51.4 /100 | #172 | Average 96.0% |
| Immigrants | Albania | 50.4 /100 | #173 | Average 96.0% |
| Mongolians | 50.0 /100 | #174 | Average 96.0% |
| Blacks/African Americans | 49.5 /100 | #175 | Average 96.0% |
| Chileans | 49.3 /100 | #176 | Average 96.0% |
| Immigrants | Korea | 49.2 /100 | #177 | Average 96.0% |
| Marshallese | 48.4 /100 | #178 | Average 96.0% |
| Immigrants | Iran | 47.8 /100 | #179 | Average 96.0% |
| Immigrants | Brazil | 46.8 /100 | #180 | Average 96.0% |
| Pakistanis | 44.5 /100 | #181 | Average 96.0% |
| Iraqis | 41.2 /100 | #182 | Average 96.0% |
| Immigrants | Spain | 38.8 /100 | #183 | Fair 96.0% |
| Sierra Leoneans | 37.5 /100 | #184 | Fair 96.0% |
| Brazilians | 37.3 /100 | #185 | Fair 96.0% |
| Immigrants | Iraq | 36.1 /100 | #186 | Fair 96.0% |
| Immigrants | Uganda | 36.0 /100 | #187 | Fair 96.0% |
| Immigrants | Egypt | 34.3 /100 | #188 | Fair 95.9% |
| Immigrants | Venezuela | 33.9 /100 | #189 | Fair 95.9% |
| Immigrants | Micronesia | 32.6 /100 | #190 | Fair 95.9% |
| Liberians | 32.5 /100 | #191 | Fair 95.9% |