Immigrants from Spain vs European 7th Grade
COMPARE
Immigrants from Spain
European
7th Grade
7th Grade Comparison
Immigrants from Spain
Europeans
96.0%
7TH GRADE
38.8/ 100
METRIC RATING
183rd/ 347
METRIC RANK
97.3%
7TH GRADE
100.0/ 100
METRIC RATING
31st/ 347
METRIC RANK
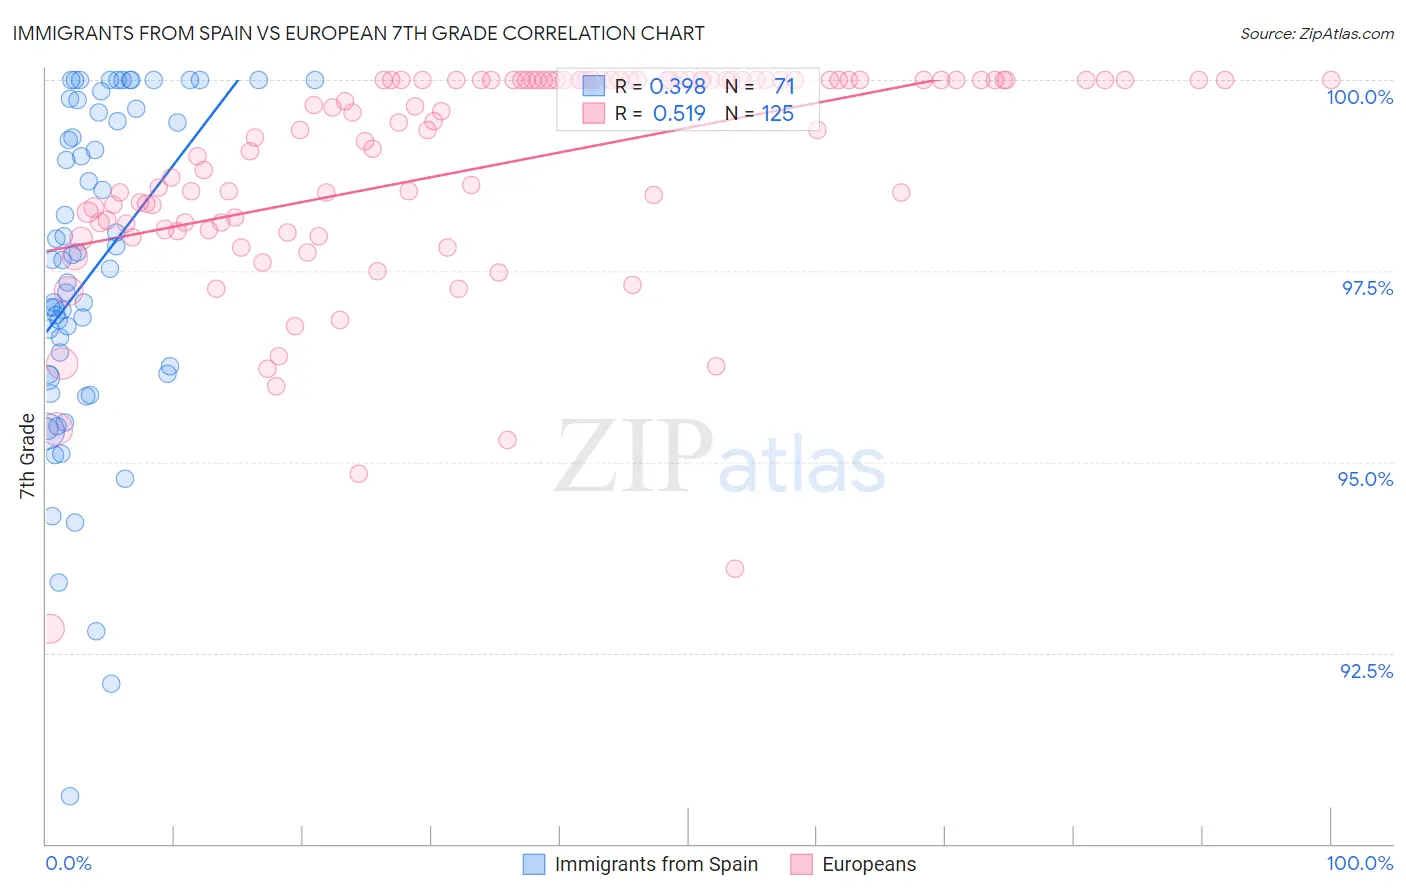
Immigrants from Spain vs European 7th Grade Correlation Chart
The statistical analysis conducted on geographies consisting of 239,679,924 people shows a mild positive correlation between the proportion of Immigrants from Spain and percentage of population with at least 7th grade education in the United States with a correlation coefficient (R) of 0.398 and weighted average of 96.0%. Similarly, the statistical analysis conducted on geographies consisting of 561,829,544 people shows a substantial positive correlation between the proportion of Europeans and percentage of population with at least 7th grade education in the United States with a correlation coefficient (R) of 0.519 and weighted average of 97.3%, a difference of 1.4%.
7th Grade Correlation Summary
| Measurement | Immigrants from Spain | European |
| Minimum | 90.6% | 92.8% |
| Maximum | 100.0% | 100.0% |
| Range | 9.4% | 7.2% |
| Mean | 97.5% | 98.9% |
| Median | 97.6% | 99.5% |
| Interquartile 25% (IQ1) | 96.1% | 98.1% |
| Interquartile 75% (IQ3) | 99.6% | 100.0% |
| Interquartile Range (IQR) | 3.4% | 1.9% |
| Standard Deviation (Sample) | 2.1% | 1.4% |
| Standard Deviation (Population) | 2.1% | 1.4% |
Similar Demographics by 7th Grade
Demographics Similar to Immigrants from Spain by 7th Grade
In terms of 7th grade, the demographic groups most similar to Immigrants from Spain are Sierra Leonean (96.0%, a difference of 0.010%), Brazilian (96.0%, a difference of 0.010%), Iraqi (96.0%, a difference of 0.020%), Immigrants from Iraq (96.0%, a difference of 0.020%), and Immigrants from Uganda (96.0%, a difference of 0.020%).
| Demographics | Rating | Rank | 7th Grade |
| Chileans | 49.3 /100 | #176 | Average 96.0% |
| Immigrants | Korea | 49.2 /100 | #177 | Average 96.0% |
| Marshallese | 48.4 /100 | #178 | Average 96.0% |
| Immigrants | Iran | 47.8 /100 | #179 | Average 96.0% |
| Immigrants | Brazil | 46.8 /100 | #180 | Average 96.0% |
| Pakistanis | 44.5 /100 | #181 | Average 96.0% |
| Iraqis | 41.2 /100 | #182 | Average 96.0% |
| Immigrants | Spain | 38.8 /100 | #183 | Fair 96.0% |
| Sierra Leoneans | 37.5 /100 | #184 | Fair 96.0% |
| Brazilians | 37.3 /100 | #185 | Fair 96.0% |
| Immigrants | Iraq | 36.1 /100 | #186 | Fair 96.0% |
| Immigrants | Uganda | 36.0 /100 | #187 | Fair 96.0% |
| Immigrants | Egypt | 34.3 /100 | #188 | Fair 95.9% |
| Immigrants | Venezuela | 33.9 /100 | #189 | Fair 95.9% |
| Immigrants | Micronesia | 32.6 /100 | #190 | Fair 95.9% |
Demographics Similar to Europeans by 7th Grade
In terms of 7th grade, the demographic groups most similar to Europeans are Italian (97.3%, a difference of 0.0%), Chippewa (97.3%, a difference of 0.010%), Czech (97.4%, a difference of 0.020%), Sioux (97.4%, a difference of 0.030%), and Scandinavian (97.4%, a difference of 0.030%).
| Demographics | Rating | Rank | 7th Grade |
| Welsh | 100.0 /100 | #24 | Exceptional 97.4% |
| French | 100.0 /100 | #25 | Exceptional 97.4% |
| Scotch-Irish | 100.0 /100 | #26 | Exceptional 97.4% |
| Danes | 100.0 /100 | #27 | Exceptional 97.4% |
| Sioux | 100.0 /100 | #28 | Exceptional 97.4% |
| Scandinavians | 100.0 /100 | #29 | Exceptional 97.4% |
| Czechs | 100.0 /100 | #30 | Exceptional 97.4% |
| Europeans | 100.0 /100 | #31 | Exceptional 97.3% |
| Italians | 100.0 /100 | #32 | Exceptional 97.3% |
| Chippewa | 100.0 /100 | #33 | Exceptional 97.3% |
| Alaska Natives | 100.0 /100 | #34 | Exceptional 97.3% |
| Swiss | 100.0 /100 | #35 | Exceptional 97.3% |
| Hungarians | 100.0 /100 | #36 | Exceptional 97.2% |
| British | 100.0 /100 | #37 | Exceptional 97.2% |
| Belgians | 100.0 /100 | #38 | Exceptional 97.2% |