Armenian vs Ghanaian 7th Grade
COMPARE
Armenian
Ghanaian
7th Grade
7th Grade Comparison
Armenians
Ghanaians
95.0%
7TH GRADE
0.1/ 100
METRIC RATING
284th/ 347
METRIC RANK
95.3%
7TH GRADE
0.7/ 100
METRIC RATING
258th/ 347
METRIC RANK
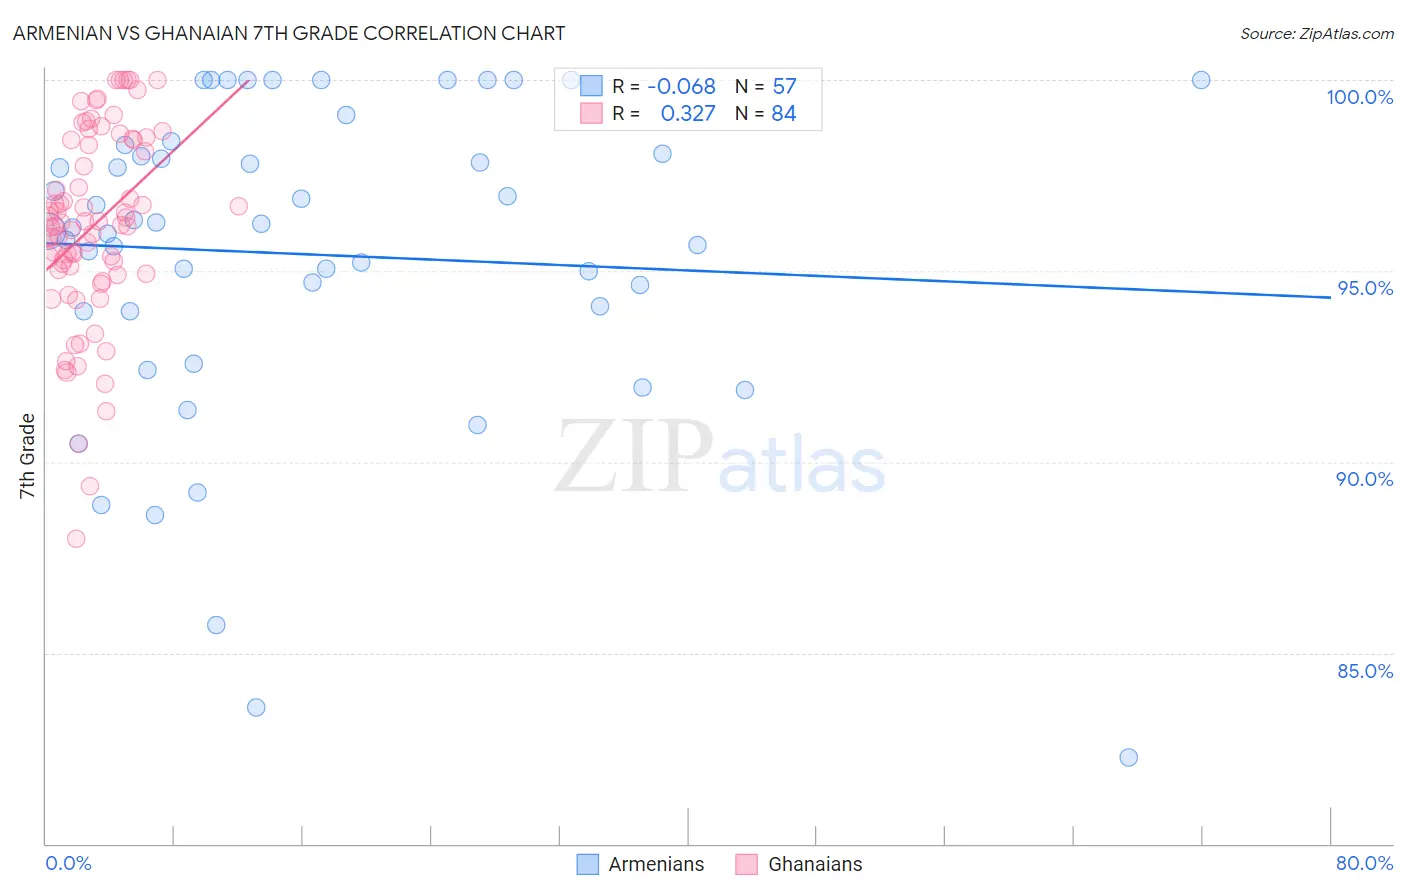
Armenian vs Ghanaian 7th Grade Correlation Chart
The statistical analysis conducted on geographies consisting of 310,954,801 people shows a slight negative correlation between the proportion of Armenians and percentage of population with at least 7th grade education in the United States with a correlation coefficient (R) of -0.068 and weighted average of 95.0%. Similarly, the statistical analysis conducted on geographies consisting of 190,712,873 people shows a mild positive correlation between the proportion of Ghanaians and percentage of population with at least 7th grade education in the United States with a correlation coefficient (R) of 0.327 and weighted average of 95.3%, a difference of 0.37%.
7th Grade Correlation Summary
| Measurement | Armenian | Ghanaian |
| Minimum | 82.3% | 88.0% |
| Maximum | 100.0% | 100.0% |
| Range | 17.7% | 12.0% |
| Mean | 95.4% | 96.2% |
| Median | 96.1% | 96.2% |
| Interquartile 25% (IQ1) | 94.0% | 95.0% |
| Interquartile 75% (IQ3) | 98.2% | 98.4% |
| Interquartile Range (IQR) | 4.2% | 3.4% |
| Standard Deviation (Sample) | 4.1% | 2.5% |
| Standard Deviation (Population) | 4.1% | 2.5% |
Similar Demographics by 7th Grade
Demographics Similar to Armenians by 7th Grade
In terms of 7th grade, the demographic groups most similar to Armenians are Immigrants from Barbados (95.0%, a difference of 0.0%), Immigrants from Eritrea (94.9%, a difference of 0.010%), Immigrants from Bolivia (95.0%, a difference of 0.060%), Immigrants from St. Vincent and the Grenadines (95.0%, a difference of 0.070%), and Tohono O'odham (95.0%, a difference of 0.070%).
| Demographics | Rating | Rank | 7th Grade |
| Immigrants | Afghanistan | 0.2 /100 | #277 | Tragic 95.1% |
| Immigrants | Trinidad and Tobago | 0.1 /100 | #278 | Tragic 95.1% |
| Barbadians | 0.1 /100 | #279 | Tragic 95.1% |
| Immigrants | St. Vincent and the Grenadines | 0.1 /100 | #280 | Tragic 95.0% |
| Tohono O'odham | 0.1 /100 | #281 | Tragic 95.0% |
| Immigrants | Bolivia | 0.1 /100 | #282 | Tragic 95.0% |
| Immigrants | Barbados | 0.1 /100 | #283 | Tragic 95.0% |
| Armenians | 0.1 /100 | #284 | Tragic 95.0% |
| Immigrants | Eritrea | 0.1 /100 | #285 | Tragic 94.9% |
| Immigrants | Philippines | 0.0 /100 | #286 | Tragic 94.9% |
| Immigrants | Peru | 0.0 /100 | #287 | Tragic 94.9% |
| British West Indians | 0.0 /100 | #288 | Tragic 94.8% |
| Taiwanese | 0.0 /100 | #289 | Tragic 94.8% |
| Malaysians | 0.0 /100 | #290 | Tragic 94.8% |
| Immigrants | Grenada | 0.0 /100 | #291 | Tragic 94.8% |
Demographics Similar to Ghanaians by 7th Grade
In terms of 7th grade, the demographic groups most similar to Ghanaians are Immigrants from China (95.3%, a difference of 0.0%), Immigrants from Congo (95.3%, a difference of 0.0%), Korean (95.3%, a difference of 0.010%), Colombian (95.3%, a difference of 0.020%), and Somali (95.3%, a difference of 0.030%).
| Demographics | Rating | Rank | 7th Grade |
| Immigrants | Jamaica | 0.9 /100 | #251 | Tragic 95.4% |
| Immigrants | Ethiopia | 0.9 /100 | #252 | Tragic 95.3% |
| Somalis | 0.9 /100 | #253 | Tragic 95.3% |
| Colombians | 0.8 /100 | #254 | Tragic 95.3% |
| Koreans | 0.8 /100 | #255 | Tragic 95.3% |
| Immigrants | China | 0.7 /100 | #256 | Tragic 95.3% |
| Immigrants | Congo | 0.7 /100 | #257 | Tragic 95.3% |
| Ghanaians | 0.7 /100 | #258 | Tragic 95.3% |
| Immigrants | Costa Rica | 0.6 /100 | #259 | Tragic 95.3% |
| Afghans | 0.5 /100 | #260 | Tragic 95.3% |
| South Americans | 0.5 /100 | #261 | Tragic 95.2% |
| Immigrants | Somalia | 0.5 /100 | #262 | Tragic 95.2% |
| West Indians | 0.5 /100 | #263 | Tragic 95.2% |
| Immigrants | Nigeria | 0.4 /100 | #264 | Tragic 95.2% |
| Immigrants | Uruguay | 0.3 /100 | #265 | Tragic 95.2% |