Immigrants from Spain vs Filipino 7th Grade
COMPARE
Immigrants from Spain
Filipino
7th Grade
7th Grade Comparison
Immigrants from Spain
Filipinos
96.0%
7TH GRADE
38.8/ 100
METRIC RATING
183rd/ 347
METRIC RANK
96.4%
7TH GRADE
92.1/ 100
METRIC RATING
131st/ 347
METRIC RANK
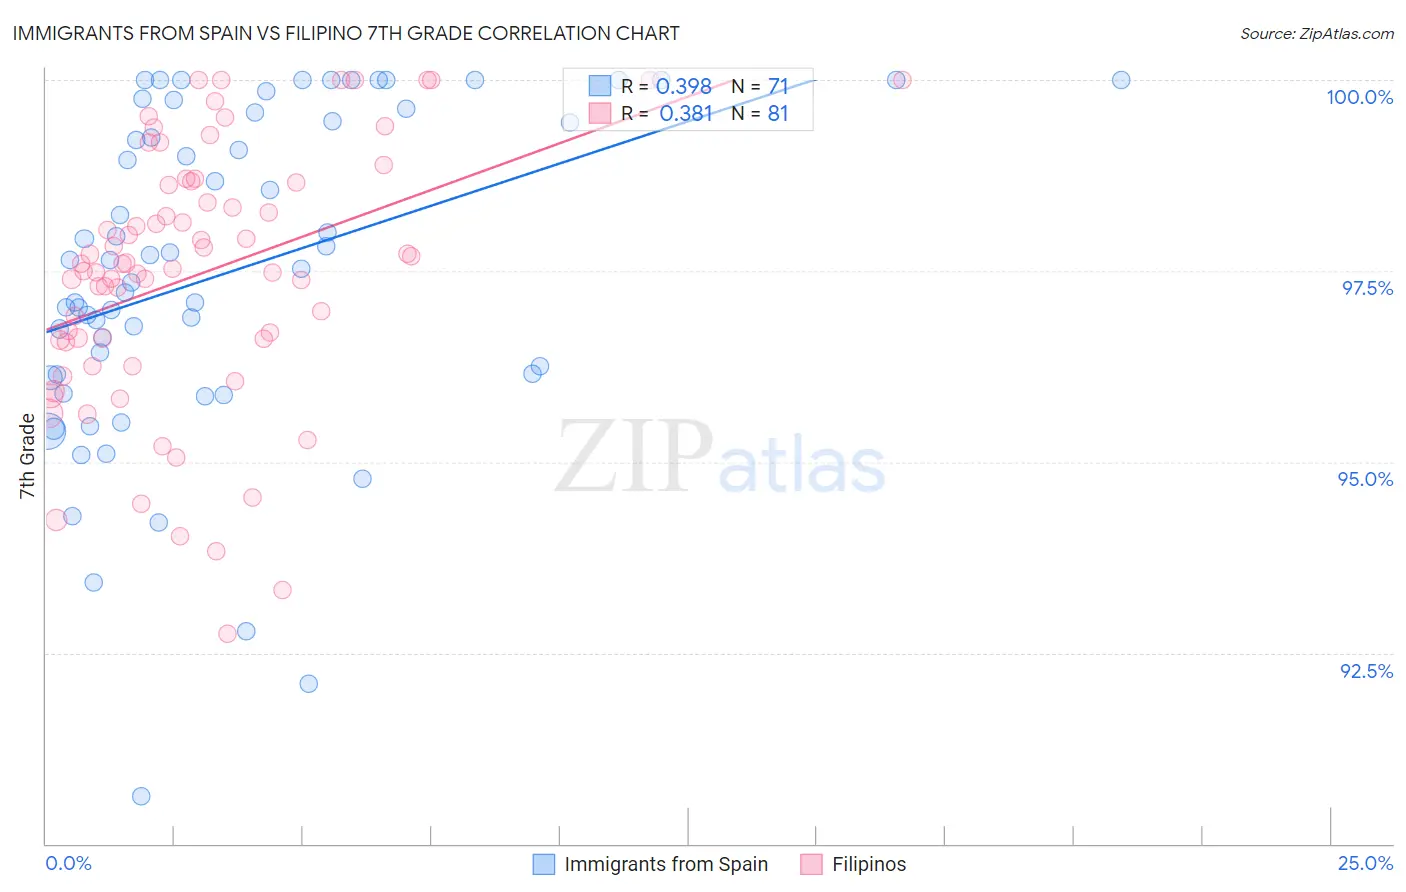
Immigrants from Spain vs Filipino 7th Grade Correlation Chart
The statistical analysis conducted on geographies consisting of 239,679,924 people shows a mild positive correlation between the proportion of Immigrants from Spain and percentage of population with at least 7th grade education in the United States with a correlation coefficient (R) of 0.398 and weighted average of 96.0%. Similarly, the statistical analysis conducted on geographies consisting of 254,351,427 people shows a mild positive correlation between the proportion of Filipinos and percentage of population with at least 7th grade education in the United States with a correlation coefficient (R) of 0.381 and weighted average of 96.4%, a difference of 0.45%.
7th Grade Correlation Summary
| Measurement | Immigrants from Spain | Filipino |
| Minimum | 90.6% | 92.7% |
| Maximum | 100.0% | 100.0% |
| Range | 9.4% | 7.3% |
| Mean | 97.5% | 97.5% |
| Median | 97.6% | 97.6% |
| Interquartile 25% (IQ1) | 96.1% | 96.6% |
| Interquartile 75% (IQ3) | 99.6% | 98.7% |
| Interquartile Range (IQR) | 3.4% | 2.1% |
| Standard Deviation (Sample) | 2.1% | 1.7% |
| Standard Deviation (Population) | 2.1% | 1.7% |
Similar Demographics by 7th Grade
Demographics Similar to Immigrants from Spain by 7th Grade
In terms of 7th grade, the demographic groups most similar to Immigrants from Spain are Sierra Leonean (96.0%, a difference of 0.010%), Brazilian (96.0%, a difference of 0.010%), Iraqi (96.0%, a difference of 0.020%), Immigrants from Iraq (96.0%, a difference of 0.020%), and Immigrants from Uganda (96.0%, a difference of 0.020%).
| Demographics | Rating | Rank | 7th Grade |
| Chileans | 49.3 /100 | #176 | Average 96.0% |
| Immigrants | Korea | 49.2 /100 | #177 | Average 96.0% |
| Marshallese | 48.4 /100 | #178 | Average 96.0% |
| Immigrants | Iran | 47.8 /100 | #179 | Average 96.0% |
| Immigrants | Brazil | 46.8 /100 | #180 | Average 96.0% |
| Pakistanis | 44.5 /100 | #181 | Average 96.0% |
| Iraqis | 41.2 /100 | #182 | Average 96.0% |
| Immigrants | Spain | 38.8 /100 | #183 | Fair 96.0% |
| Sierra Leoneans | 37.5 /100 | #184 | Fair 96.0% |
| Brazilians | 37.3 /100 | #185 | Fair 96.0% |
| Immigrants | Iraq | 36.1 /100 | #186 | Fair 96.0% |
| Immigrants | Uganda | 36.0 /100 | #187 | Fair 96.0% |
| Immigrants | Egypt | 34.3 /100 | #188 | Fair 95.9% |
| Immigrants | Venezuela | 33.9 /100 | #189 | Fair 95.9% |
| Immigrants | Micronesia | 32.6 /100 | #190 | Fair 95.9% |
Demographics Similar to Filipinos by 7th Grade
In terms of 7th grade, the demographic groups most similar to Filipinos are Colville (96.4%, a difference of 0.010%), Hmong (96.4%, a difference of 0.010%), Immigrants from Romania (96.4%, a difference of 0.020%), Immigrants from North Macedonia (96.4%, a difference of 0.020%), and Immigrants from Serbia (96.4%, a difference of 0.020%).
| Demographics | Rating | Rank | 7th Grade |
| Immigrants | Switzerland | 94.5 /100 | #124 | Exceptional 96.5% |
| Immigrants | Bulgaria | 94.0 /100 | #125 | Exceptional 96.4% |
| Palestinians | 93.5 /100 | #126 | Exceptional 96.4% |
| Immigrants | Bosnia and Herzegovina | 93.3 /100 | #127 | Exceptional 96.4% |
| Immigrants | Romania | 93.2 /100 | #128 | Exceptional 96.4% |
| Immigrants | North Macedonia | 93.1 /100 | #129 | Exceptional 96.4% |
| Immigrants | Serbia | 92.8 /100 | #130 | Exceptional 96.4% |
| Filipinos | 92.1 /100 | #131 | Exceptional 96.4% |
| Colville | 91.7 /100 | #132 | Exceptional 96.4% |
| Hmong | 91.5 /100 | #133 | Exceptional 96.4% |
| Soviet Union | 91.2 /100 | #134 | Exceptional 96.4% |
| Immigrants | Kuwait | 91.1 /100 | #135 | Exceptional 96.4% |
| Immigrants | Hungary | 90.6 /100 | #136 | Exceptional 96.4% |
| Immigrants | Turkey | 90.2 /100 | #137 | Exceptional 96.4% |
| Jordanians | 90.0 /100 | #138 | Excellent 96.4% |