Immigrants from Southern Europe vs French Canadian No Schooling Completed
COMPARE
Immigrants from Southern Europe
French Canadian
No Schooling Completed
No Schooling Completed Comparison
Immigrants from Southern Europe
French Canadians
2.2%
NO SCHOOLING COMPLETED
23.8/ 100
METRIC RATING
197th/ 347
METRIC RANK
1.5%
NO SCHOOLING COMPLETED
100.0/ 100
METRIC RATING
28th/ 347
METRIC RANK
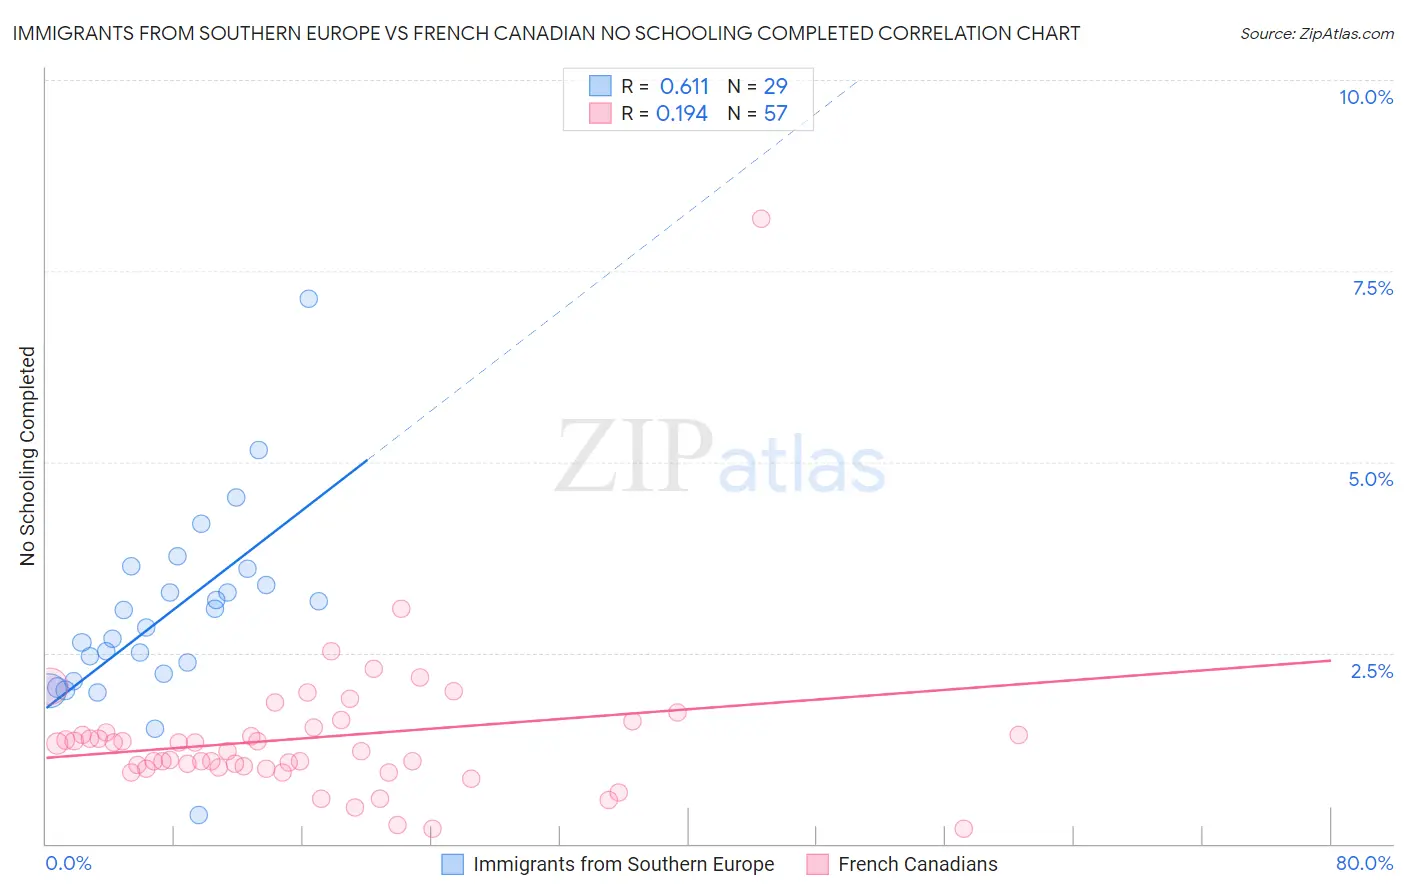
Immigrants from Southern Europe vs French Canadian No Schooling Completed Correlation Chart
The statistical analysis conducted on geographies consisting of 398,295,822 people shows a significant positive correlation between the proportion of Immigrants from Southern Europe and percentage of population with no schooling in the United States with a correlation coefficient (R) of 0.611 and weighted average of 2.2%. Similarly, the statistical analysis conducted on geographies consisting of 491,496,199 people shows a poor positive correlation between the proportion of French Canadians and percentage of population with no schooling in the United States with a correlation coefficient (R) of 0.194 and weighted average of 1.5%, a difference of 44.8%.
No Schooling Completed Correlation Summary
| Measurement | Immigrants from Southern Europe | French Canadian |
| Minimum | 0.38% | 0.20% |
| Maximum | 7.1% | 8.2% |
| Range | 6.8% | 8.0% |
| Mean | 3.0% | 1.4% |
| Median | 2.8% | 1.2% |
| Interquartile 25% (IQ1) | 2.2% | 0.99% |
| Interquartile 75% (IQ3) | 3.5% | 1.5% |
| Interquartile Range (IQR) | 1.3% | 0.49% |
| Standard Deviation (Sample) | 1.2% | 1.1% |
| Standard Deviation (Population) | 1.2% | 1.1% |
Similar Demographics by No Schooling Completed
Demographics Similar to Immigrants from Southern Europe by No Schooling Completed
In terms of no schooling completed, the demographic groups most similar to Immigrants from Southern Europe are Immigrants from Chile (2.2%, a difference of 0.18%), African (2.2%, a difference of 0.35%), Immigrants from Ukraine (2.2%, a difference of 0.41%), Hawaiian (2.2%, a difference of 0.56%), and Immigrants from Albania (2.2%, a difference of 0.76%).
| Demographics | Rating | Rank | No Schooling Completed |
| Spanish Americans | 32.6 /100 | #190 | Fair 2.1% |
| Bermudans | 30.7 /100 | #191 | Fair 2.1% |
| Guamanians/Chamorros | 29.8 /100 | #192 | Fair 2.2% |
| Paraguayans | 29.3 /100 | #193 | Fair 2.2% |
| Immigrants | Albania | 28.3 /100 | #194 | Fair 2.2% |
| Hawaiians | 27.0 /100 | #195 | Fair 2.2% |
| Immigrants | Ukraine | 26.1 /100 | #196 | Fair 2.2% |
| Immigrants | Southern Europe | 23.8 /100 | #197 | Fair 2.2% |
| Immigrants | Chile | 22.7 /100 | #198 | Fair 2.2% |
| Africans | 21.8 /100 | #199 | Fair 2.2% |
| Immigrants | Northern Africa | 19.5 /100 | #200 | Poor 2.2% |
| Costa Ricans | 17.1 /100 | #201 | Poor 2.2% |
| Moroccans | 13.7 /100 | #202 | Poor 2.2% |
| Laotians | 13.3 /100 | #203 | Poor 2.2% |
| Hopi | 12.9 /100 | #204 | Poor 2.2% |
Demographics Similar to French Canadians by No Schooling Completed
In terms of no schooling completed, the demographic groups most similar to French Canadians are Scandinavian (1.5%, a difference of 0.010%), Czech (1.5%, a difference of 0.54%), Lumbee (1.5%, a difference of 0.91%), French (1.5%, a difference of 1.1%), and Pennsylvania German (1.5%, a difference of 1.1%).
| Demographics | Rating | Rank | No Schooling Completed |
| Chinese | 100.0 /100 | #21 | Exceptional 1.5% |
| Alaska Natives | 100.0 /100 | #22 | Exceptional 1.5% |
| Europeans | 100.0 /100 | #23 | Exceptional 1.5% |
| Pennsylvania Germans | 100.0 /100 | #24 | Exceptional 1.5% |
| French | 100.0 /100 | #25 | Exceptional 1.5% |
| Czechs | 100.0 /100 | #26 | Exceptional 1.5% |
| Scandinavians | 100.0 /100 | #27 | Exceptional 1.5% |
| French Canadians | 100.0 /100 | #28 | Exceptional 1.5% |
| Lumbee | 100.0 /100 | #29 | Exceptional 1.5% |
| British | 100.0 /100 | #30 | Exceptional 1.5% |
| Inupiat | 100.0 /100 | #31 | Exceptional 1.5% |
| Swiss | 100.0 /100 | #32 | Exceptional 1.5% |
| Italians | 100.0 /100 | #33 | Exceptional 1.5% |
| Latvians | 100.0 /100 | #34 | Exceptional 1.5% |
| Eastern Europeans | 100.0 /100 | #35 | Exceptional 1.6% |