Immigrants from Southern Europe vs Immigrants from Jordan No Schooling Completed
COMPARE
Immigrants from Southern Europe
Immigrants from Jordan
No Schooling Completed
No Schooling Completed Comparison
Immigrants from Southern Europe
Immigrants from Jordan
2.2%
NO SCHOOLING COMPLETED
23.8/ 100
METRIC RATING
197th/ 347
METRIC RANK
2.0%
NO SCHOOLING COMPLETED
70.9/ 100
METRIC RATING
151st/ 347
METRIC RANK
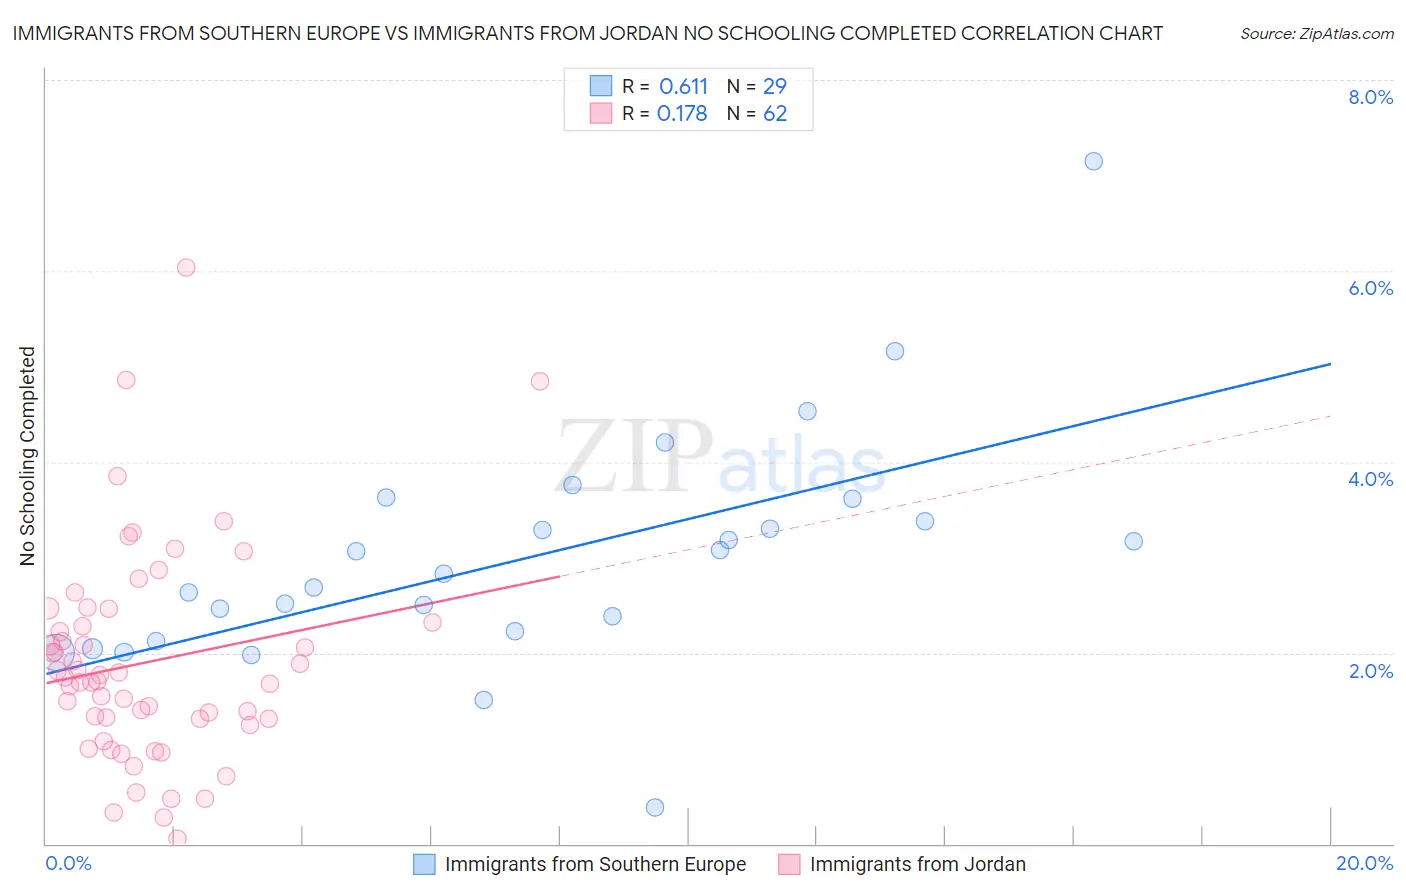
Immigrants from Southern Europe vs Immigrants from Jordan No Schooling Completed Correlation Chart
The statistical analysis conducted on geographies consisting of 398,295,822 people shows a significant positive correlation between the proportion of Immigrants from Southern Europe and percentage of population with no schooling in the United States with a correlation coefficient (R) of 0.611 and weighted average of 2.2%. Similarly, the statistical analysis conducted on geographies consisting of 180,880,658 people shows a poor positive correlation between the proportion of Immigrants from Jordan and percentage of population with no schooling in the United States with a correlation coefficient (R) of 0.178 and weighted average of 2.0%, a difference of 7.1%.
No Schooling Completed Correlation Summary
| Measurement | Immigrants from Southern Europe | Immigrants from Jordan |
| Minimum | 0.38% | 0.047% |
| Maximum | 7.1% | 6.0% |
| Range | 6.8% | 6.0% |
| Mean | 3.0% | 1.9% |
| Median | 2.8% | 1.7% |
| Interquartile 25% (IQ1) | 2.2% | 1.3% |
| Interquartile 75% (IQ3) | 3.5% | 2.3% |
| Interquartile Range (IQR) | 1.3% | 1.0% |
| Standard Deviation (Sample) | 1.2% | 1.1% |
| Standard Deviation (Population) | 1.2% | 1.1% |
Similar Demographics by No Schooling Completed
Demographics Similar to Immigrants from Southern Europe by No Schooling Completed
In terms of no schooling completed, the demographic groups most similar to Immigrants from Southern Europe are Immigrants from Chile (2.2%, a difference of 0.18%), African (2.2%, a difference of 0.35%), Immigrants from Ukraine (2.2%, a difference of 0.41%), Hawaiian (2.2%, a difference of 0.56%), and Immigrants from Albania (2.2%, a difference of 0.76%).
| Demographics | Rating | Rank | No Schooling Completed |
| Spanish Americans | 32.6 /100 | #190 | Fair 2.1% |
| Bermudans | 30.7 /100 | #191 | Fair 2.1% |
| Guamanians/Chamorros | 29.8 /100 | #192 | Fair 2.2% |
| Paraguayans | 29.3 /100 | #193 | Fair 2.2% |
| Immigrants | Albania | 28.3 /100 | #194 | Fair 2.2% |
| Hawaiians | 27.0 /100 | #195 | Fair 2.2% |
| Immigrants | Ukraine | 26.1 /100 | #196 | Fair 2.2% |
| Immigrants | Southern Europe | 23.8 /100 | #197 | Fair 2.2% |
| Immigrants | Chile | 22.7 /100 | #198 | Fair 2.2% |
| Africans | 21.8 /100 | #199 | Fair 2.2% |
| Immigrants | Northern Africa | 19.5 /100 | #200 | Poor 2.2% |
| Costa Ricans | 17.1 /100 | #201 | Poor 2.2% |
| Moroccans | 13.7 /100 | #202 | Poor 2.2% |
| Laotians | 13.3 /100 | #203 | Poor 2.2% |
| Hopi | 12.9 /100 | #204 | Poor 2.2% |
Demographics Similar to Immigrants from Jordan by No Schooling Completed
In terms of no schooling completed, the demographic groups most similar to Immigrants from Jordan are Immigrants from Eastern Europe (2.0%, a difference of 0.090%), Immigrants from Italy (2.0%, a difference of 0.33%), Blackfeet (2.0%, a difference of 0.34%), Immigrants from Venezuela (2.0%, a difference of 0.39%), and Immigrants from Russia (2.0%, a difference of 0.53%).
| Demographics | Rating | Rank | No Schooling Completed |
| Alsatians | 79.1 /100 | #144 | Good 2.0% |
| Immigrants | Iran | 79.0 /100 | #145 | Good 2.0% |
| Immigrants | Moldova | 78.0 /100 | #146 | Good 2.0% |
| Soviet Union | 77.1 /100 | #147 | Good 2.0% |
| Shoshone | 76.7 /100 | #148 | Good 2.0% |
| Immigrants | North Macedonia | 75.9 /100 | #149 | Good 2.0% |
| Blackfeet | 72.9 /100 | #150 | Good 2.0% |
| Immigrants | Jordan | 70.9 /100 | #151 | Good 2.0% |
| Immigrants | Eastern Europe | 70.4 /100 | #152 | Good 2.0% |
| Immigrants | Italy | 68.9 /100 | #153 | Good 2.0% |
| Immigrants | Venezuela | 68.5 /100 | #154 | Good 2.0% |
| Immigrants | Russia | 67.6 /100 | #155 | Good 2.0% |
| Chileans | 67.2 /100 | #156 | Good 2.0% |
| Immigrants | Sri Lanka | 67.0 /100 | #157 | Good 2.0% |
| Immigrants | Korea | 66.7 /100 | #158 | Good 2.0% |