Cambodian vs Vietnamese College, 1 year or more
COMPARE
Cambodian
Vietnamese
College, 1 year or more
College, 1 year or more Comparison
Cambodians
Vietnamese
66.7%
COLLEGE, 1 YEAR OR MORE
100.0/ 100
METRIC RATING
15th/ 347
METRIC RANK
57.0%
COLLEGE, 1 YEAR OR MORE
4.7/ 100
METRIC RATING
225th/ 347
METRIC RANK
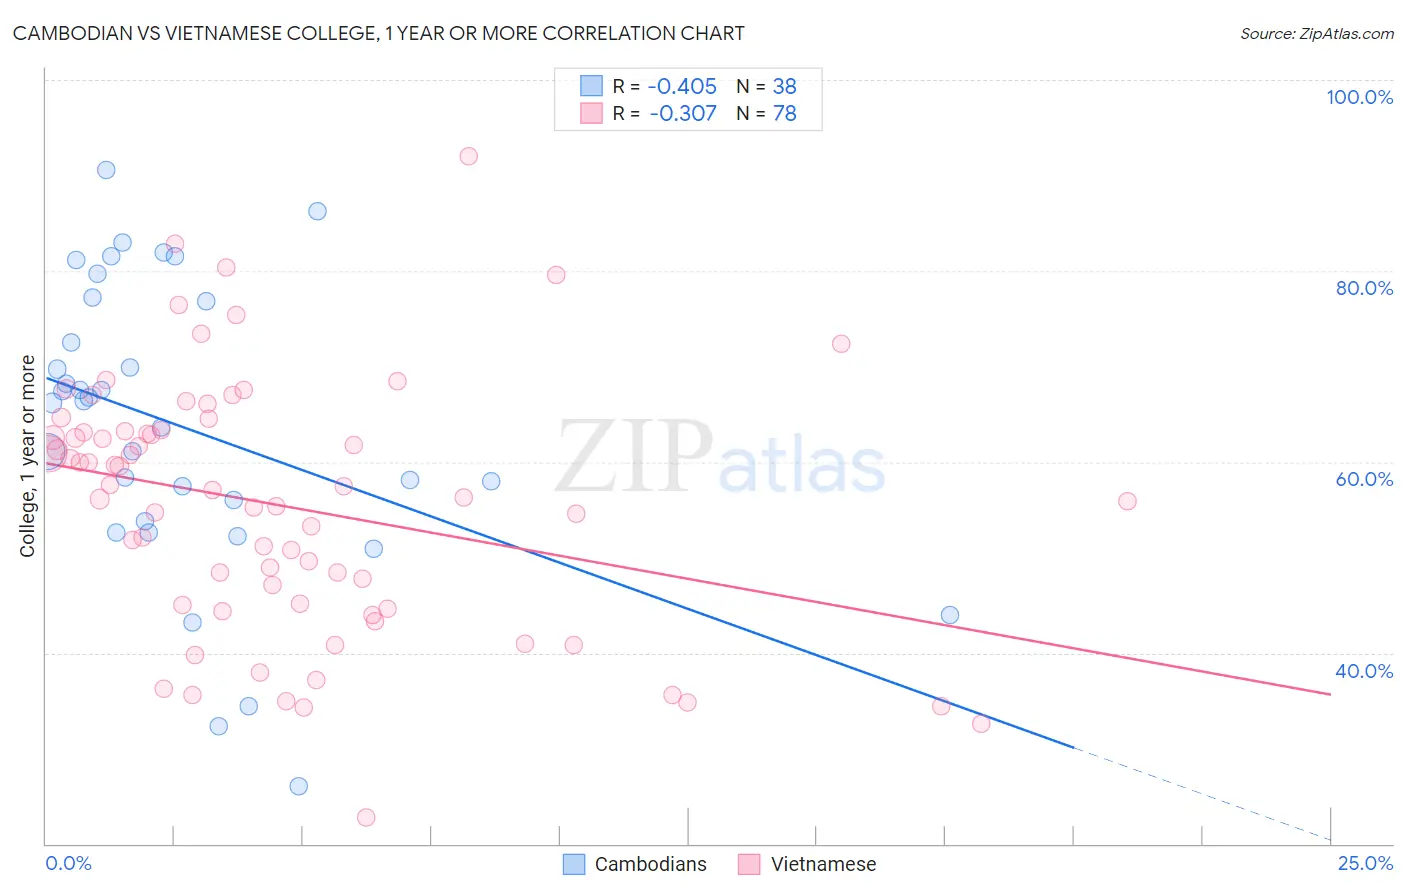
Cambodian vs Vietnamese College, 1 year or more Correlation Chart
The statistical analysis conducted on geographies consisting of 102,514,976 people shows a moderate negative correlation between the proportion of Cambodians and percentage of population with at least college, 1 year or more education in the United States with a correlation coefficient (R) of -0.405 and weighted average of 66.7%. Similarly, the statistical analysis conducted on geographies consisting of 170,751,543 people shows a mild negative correlation between the proportion of Vietnamese and percentage of population with at least college, 1 year or more education in the United States with a correlation coefficient (R) of -0.307 and weighted average of 57.0%, a difference of 16.9%.
College, 1 year or more Correlation Summary
| Measurement | Cambodian | Vietnamese |
| Minimum | 26.0% | 22.8% |
| Maximum | 90.6% | 92.0% |
| Range | 64.6% | 69.3% |
| Mean | 63.6% | 55.4% |
| Median | 66.3% | 56.7% |
| Interquartile 25% (IQ1) | 53.8% | 45.0% |
| Interquartile 75% (IQ3) | 76.8% | 63.2% |
| Interquartile Range (IQR) | 23.0% | 18.3% |
| Standard Deviation (Sample) | 15.3% | 13.4% |
| Standard Deviation (Population) | 15.1% | 13.3% |
Similar Demographics by College, 1 year or more
Demographics Similar to Cambodians by College, 1 year or more
In terms of college, 1 year or more, the demographic groups most similar to Cambodians are Burmese (66.7%, a difference of 0.0%), Immigrants from Japan (66.7%, a difference of 0.030%), Immigrants from Eastern Asia (66.6%, a difference of 0.15%), Immigrants from Sweden (66.8%, a difference of 0.19%), and Eastern European (66.6%, a difference of 0.22%).
| Demographics | Rating | Rank | College, 1 year or more |
| Thais | 100.0 /100 | #8 | Exceptional 68.6% |
| Immigrants | Israel | 100.0 /100 | #9 | Exceptional 67.8% |
| Immigrants | Australia | 100.0 /100 | #10 | Exceptional 67.7% |
| Immigrants | South Central Asia | 100.0 /100 | #11 | Exceptional 67.1% |
| Cypriots | 100.0 /100 | #12 | Exceptional 67.0% |
| Immigrants | Sweden | 100.0 /100 | #13 | Exceptional 66.8% |
| Burmese | 100.0 /100 | #14 | Exceptional 66.7% |
| Cambodians | 100.0 /100 | #15 | Exceptional 66.7% |
| Immigrants | Japan | 100.0 /100 | #16 | Exceptional 66.7% |
| Immigrants | Eastern Asia | 100.0 /100 | #17 | Exceptional 66.6% |
| Eastern Europeans | 100.0 /100 | #18 | Exceptional 66.6% |
| Immigrants | Switzerland | 100.0 /100 | #19 | Exceptional 66.5% |
| Immigrants | Korea | 100.0 /100 | #20 | Exceptional 66.5% |
| Immigrants | Hong Kong | 100.0 /100 | #21 | Exceptional 66.4% |
| Soviet Union | 100.0 /100 | #22 | Exceptional 66.4% |
Demographics Similar to Vietnamese by College, 1 year or more
In terms of college, 1 year or more, the demographic groups most similar to Vietnamese are Immigrants from Western Africa (57.0%, a difference of 0.030%), Immigrants (57.0%, a difference of 0.090%), Portuguese (57.2%, a difference of 0.21%), Hmong (57.2%, a difference of 0.21%), and Immigrants from Fiji (56.9%, a difference of 0.24%).
| Demographics | Rating | Rank | College, 1 year or more |
| Native Hawaiians | 9.0 /100 | #218 | Tragic 57.6% |
| Whites/Caucasians | 8.7 /100 | #219 | Tragic 57.6% |
| Immigrants | Costa Rica | 8.0 /100 | #220 | Tragic 57.5% |
| Immigrants | Ghana | 7.7 /100 | #221 | Tragic 57.4% |
| Sub-Saharan Africans | 6.1 /100 | #222 | Tragic 57.3% |
| Portuguese | 5.4 /100 | #223 | Tragic 57.2% |
| Hmong | 5.4 /100 | #224 | Tragic 57.2% |
| Vietnamese | 4.7 /100 | #225 | Tragic 57.0% |
| Immigrants | Western Africa | 4.6 /100 | #226 | Tragic 57.0% |
| Immigrants | Immigrants | 4.4 /100 | #227 | Tragic 57.0% |
| Immigrants | Fiji | 4.0 /100 | #228 | Tragic 56.9% |
| Cree | 3.6 /100 | #229 | Tragic 56.8% |
| Liberians | 3.1 /100 | #230 | Tragic 56.7% |
| Immigrants | Burma/Myanmar | 2.7 /100 | #231 | Tragic 56.6% |
| Immigrants | Bangladesh | 2.6 /100 | #232 | Tragic 56.6% |