Immigrants from South Eastern Asia vs Immigrants from Bangladesh Kindergarten
COMPARE
Immigrants from South Eastern Asia
Immigrants from Bangladesh
Kindergarten
Kindergarten Comparison
Immigrants from South Eastern Asia
Immigrants from Bangladesh
97.1%
KINDERGARTEN
0.0/ 100
METRIC RATING
301st/ 347
METRIC RANK
96.8%
KINDERGARTEN
0.0/ 100
METRIC RATING
321st/ 347
METRIC RANK
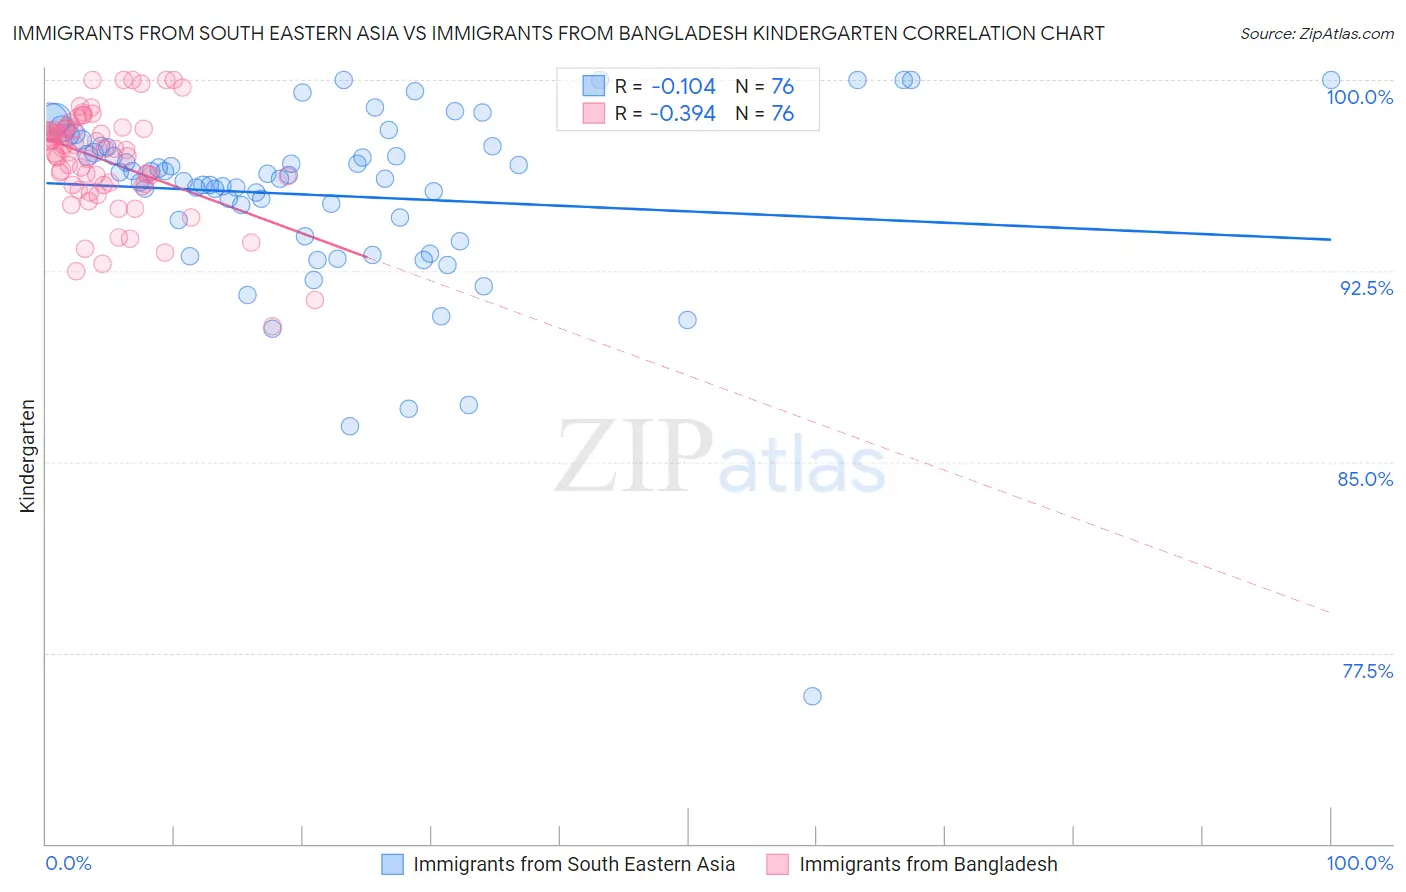
Immigrants from South Eastern Asia vs Immigrants from Bangladesh Kindergarten Correlation Chart
The statistical analysis conducted on geographies consisting of 512,710,277 people shows a poor negative correlation between the proportion of Immigrants from South Eastern Asia and percentage of population with at least kindergarten education in the United States with a correlation coefficient (R) of -0.104 and weighted average of 97.1%. Similarly, the statistical analysis conducted on geographies consisting of 203,681,254 people shows a mild negative correlation between the proportion of Immigrants from Bangladesh and percentage of population with at least kindergarten education in the United States with a correlation coefficient (R) of -0.394 and weighted average of 96.8%, a difference of 0.28%.
Kindergarten Correlation Summary
| Measurement | Immigrants from South Eastern Asia | Immigrants from Bangladesh |
| Minimum | 75.8% | 90.3% |
| Maximum | 100.0% | 100.0% |
| Range | 24.2% | 9.7% |
| Mean | 95.5% | 96.8% |
| Median | 96.2% | 97.2% |
| Interquartile 25% (IQ1) | 94.2% | 95.9% |
| Interquartile 75% (IQ3) | 97.4% | 98.1% |
| Interquartile Range (IQR) | 3.2% | 2.2% |
| Standard Deviation (Sample) | 3.7% | 2.0% |
| Standard Deviation (Population) | 3.7% | 2.0% |
Demographics Similar to Immigrants from South Eastern Asia and Immigrants from Bangladesh by Kindergarten
In terms of kindergarten, the demographic groups most similar to Immigrants from South Eastern Asia are Immigrants from Caribbean (97.1%, a difference of 0.030%), Somali (97.0%, a difference of 0.070%), Nicaraguan (97.0%, a difference of 0.070%), Ecuadorian (97.0%, a difference of 0.070%), and Belizean (97.0%, a difference of 0.12%). Similarly, the demographic groups most similar to Immigrants from Bangladesh are Immigrants from Guyana (96.8%, a difference of 0.010%), Immigrants from Burma/Myanmar (96.8%, a difference of 0.010%), Immigrants from Laos (96.9%, a difference of 0.020%), Immigrants from Nicaragua (96.9%, a difference of 0.070%), and Immigrants from Ecuador (96.9%, a difference of 0.070%).
| Demographics | Rating | Rank | Kindergarten |
| Immigrants | South Eastern Asia | 0.0 /100 | #301 | Tragic 97.1% |
| Immigrants | Caribbean | 0.0 /100 | #302 | Tragic 97.1% |
| Somalis | 0.0 /100 | #303 | Tragic 97.0% |
| Nicaraguans | 0.0 /100 | #304 | Tragic 97.0% |
| Ecuadorians | 0.0 /100 | #305 | Tragic 97.0% |
| Belizeans | 0.0 /100 | #306 | Tragic 97.0% |
| Hispanics or Latinos | 0.0 /100 | #307 | Tragic 97.0% |
| Immigrants | Somalia | 0.0 /100 | #308 | Tragic 97.0% |
| Immigrants | Haiti | 0.0 /100 | #309 | Tragic 97.0% |
| Immigrants | Azores | 0.0 /100 | #310 | Tragic 97.0% |
| Sri Lankans | 0.0 /100 | #311 | Tragic 97.0% |
| Guyanese | 0.0 /100 | #312 | Tragic 96.9% |
| Cape Verdeans | 0.0 /100 | #313 | Tragic 96.9% |
| Hondurans | 0.0 /100 | #314 | Tragic 96.9% |
| Immigrants | Belize | 0.0 /100 | #315 | Tragic 96.9% |
| Immigrants | Nicaragua | 0.0 /100 | #316 | Tragic 96.9% |
| Immigrants | Ecuador | 0.0 /100 | #317 | Tragic 96.9% |
| Immigrants | Laos | 0.0 /100 | #318 | Tragic 96.9% |
| Immigrants | Guyana | 0.0 /100 | #319 | Tragic 96.8% |
| Immigrants | Burma/Myanmar | 0.0 /100 | #320 | Tragic 96.8% |
| Immigrants | Bangladesh | 0.0 /100 | #321 | Tragic 96.8% |