Immigrants from South Eastern Asia vs Cree Kindergarten
COMPARE
Immigrants from South Eastern Asia
Cree
Kindergarten
Kindergarten Comparison
Immigrants from South Eastern Asia
Cree
97.1%
KINDERGARTEN
0.0/ 100
METRIC RATING
301st/ 347
METRIC RANK
98.2%
KINDERGARTEN
97.7/ 100
METRIC RATING
102nd/ 347
METRIC RANK
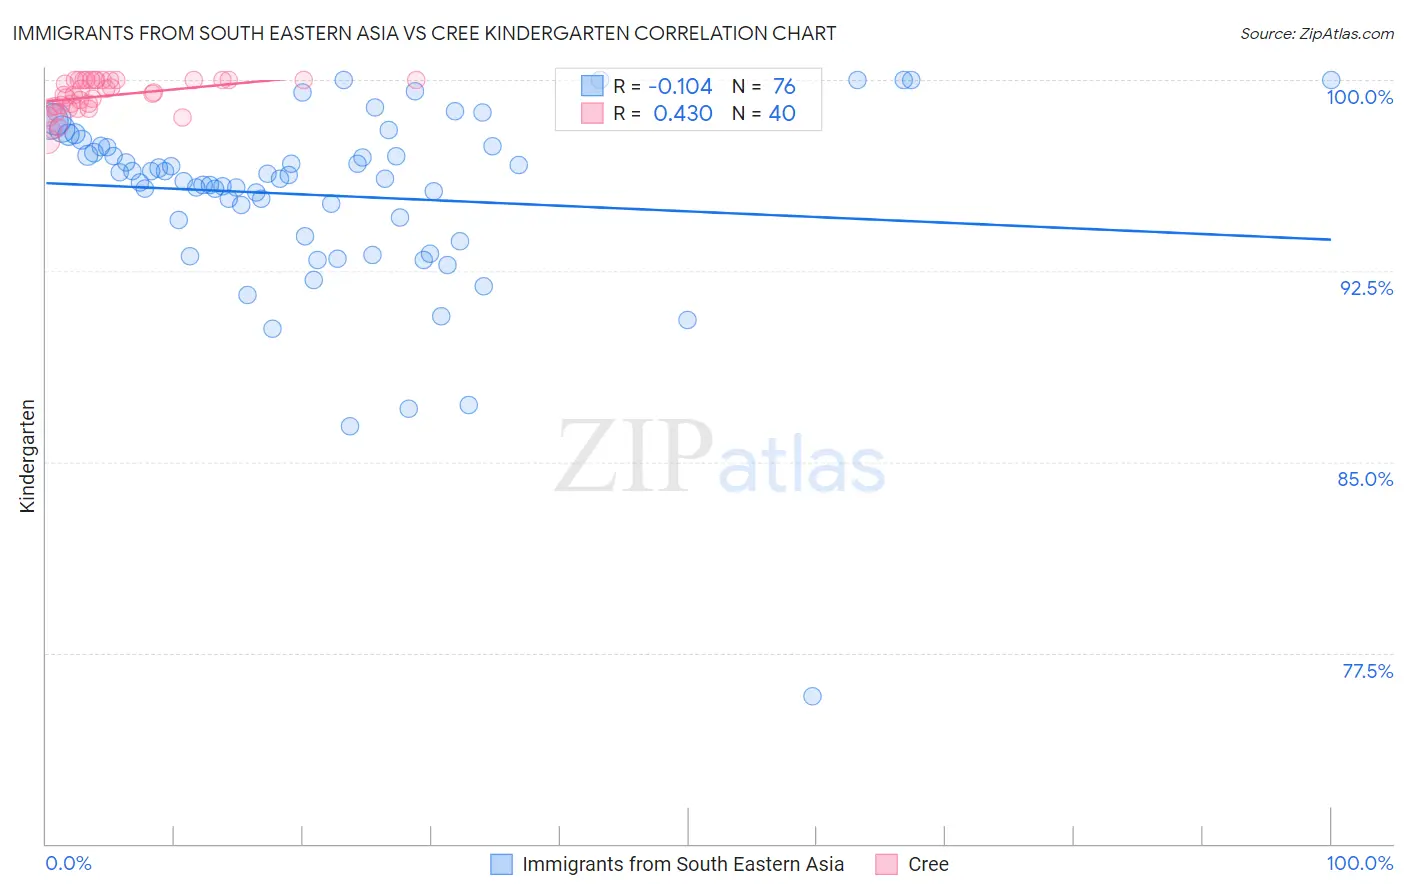
Immigrants from South Eastern Asia vs Cree Kindergarten Correlation Chart
The statistical analysis conducted on geographies consisting of 512,710,277 people shows a poor negative correlation between the proportion of Immigrants from South Eastern Asia and percentage of population with at least kindergarten education in the United States with a correlation coefficient (R) of -0.104 and weighted average of 97.1%. Similarly, the statistical analysis conducted on geographies consisting of 76,204,399 people shows a moderate positive correlation between the proportion of Cree and percentage of population with at least kindergarten education in the United States with a correlation coefficient (R) of 0.430 and weighted average of 98.2%, a difference of 1.2%.
Kindergarten Correlation Summary
| Measurement | Immigrants from South Eastern Asia | Cree |
| Minimum | 75.8% | 97.6% |
| Maximum | 100.0% | 100.0% |
| Range | 24.2% | 2.4% |
| Mean | 95.5% | 99.4% |
| Median | 96.2% | 99.5% |
| Interquartile 25% (IQ1) | 94.2% | 98.9% |
| Interquartile 75% (IQ3) | 97.4% | 100.0% |
| Interquartile Range (IQR) | 3.2% | 1.1% |
| Standard Deviation (Sample) | 3.7% | 0.64% |
| Standard Deviation (Population) | 3.7% | 0.63% |
Similar Demographics by Kindergarten
Demographics Similar to Immigrants from South Eastern Asia by Kindergarten
In terms of kindergarten, the demographic groups most similar to Immigrants from South Eastern Asia are Haitian (97.1%, a difference of 0.020%), Immigrants from Cuba (97.1%, a difference of 0.030%), Immigrants from Caribbean (97.1%, a difference of 0.030%), Immigrants from Dominica (97.1%, a difference of 0.040%), and Central American Indian (97.2%, a difference of 0.050%).
| Demographics | Rating | Rank | Kindergarten |
| Immigrants | Immigrants | 0.0 /100 | #294 | Tragic 97.2% |
| Immigrants | Grenada | 0.0 /100 | #295 | Tragic 97.2% |
| Immigrants | Eritrea | 0.0 /100 | #296 | Tragic 97.2% |
| Central American Indians | 0.0 /100 | #297 | Tragic 97.2% |
| Immigrants | Dominica | 0.0 /100 | #298 | Tragic 97.1% |
| Immigrants | Cuba | 0.0 /100 | #299 | Tragic 97.1% |
| Haitians | 0.0 /100 | #300 | Tragic 97.1% |
| Immigrants | South Eastern Asia | 0.0 /100 | #301 | Tragic 97.1% |
| Immigrants | Caribbean | 0.0 /100 | #302 | Tragic 97.1% |
| Somalis | 0.0 /100 | #303 | Tragic 97.0% |
| Nicaraguans | 0.0 /100 | #304 | Tragic 97.0% |
| Ecuadorians | 0.0 /100 | #305 | Tragic 97.0% |
| Belizeans | 0.0 /100 | #306 | Tragic 97.0% |
| Hispanics or Latinos | 0.0 /100 | #307 | Tragic 97.0% |
| Immigrants | Somalia | 0.0 /100 | #308 | Tragic 97.0% |
Demographics Similar to Cree by Kindergarten
In terms of kindergarten, the demographic groups most similar to Cree are Romanian (98.2%, a difference of 0.0%), Immigrants from Ireland (98.2%, a difference of 0.0%), Bhutanese (98.2%, a difference of 0.010%), Pima (98.2%, a difference of 0.010%), and Basque (98.2%, a difference of 0.010%).
| Demographics | Rating | Rank | Kindergarten |
| Immigrants | Germany | 98.5 /100 | #95 | Exceptional 98.3% |
| Immigrants | Nonimmigrants | 98.3 /100 | #96 | Exceptional 98.3% |
| Cypriots | 98.3 /100 | #97 | Exceptional 98.3% |
| Choctaw | 98.2 /100 | #98 | Exceptional 98.3% |
| Colville | 98.2 /100 | #99 | Exceptional 98.3% |
| Puget Sound Salish | 98.1 /100 | #100 | Exceptional 98.2% |
| Romanians | 97.8 /100 | #101 | Exceptional 98.2% |
| Cree | 97.7 /100 | #102 | Exceptional 98.2% |
| Immigrants | Ireland | 97.6 /100 | #103 | Exceptional 98.2% |
| Bhutanese | 97.3 /100 | #104 | Exceptional 98.2% |
| Pima | 97.3 /100 | #105 | Exceptional 98.2% |
| Basques | 97.3 /100 | #106 | Exceptional 98.2% |
| Turks | 97.3 /100 | #107 | Exceptional 98.2% |
| Immigrants | Switzerland | 97.2 /100 | #108 | Exceptional 98.2% |
| German Russians | 97.1 /100 | #109 | Exceptional 98.2% |