Immigrants from South Eastern Asia vs Immigrants from Bangladesh Female Poverty Among 25-34 Year Olds
COMPARE
Immigrants from South Eastern Asia
Immigrants from Bangladesh
Female Poverty Among 25-34 Year Olds
Female Poverty Among 25-34 Year Olds Comparison
Immigrants from South Eastern Asia
Immigrants from Bangladesh
12.5%
FEMALE POVERTY AMONG 25-34 YEAR OLDS
97.6/ 100
METRIC RATING
85th/ 347
METRIC RANK
14.8%
FEMALE POVERTY AMONG 25-34 YEAR OLDS
1.1/ 100
METRIC RATING
244th/ 347
METRIC RANK
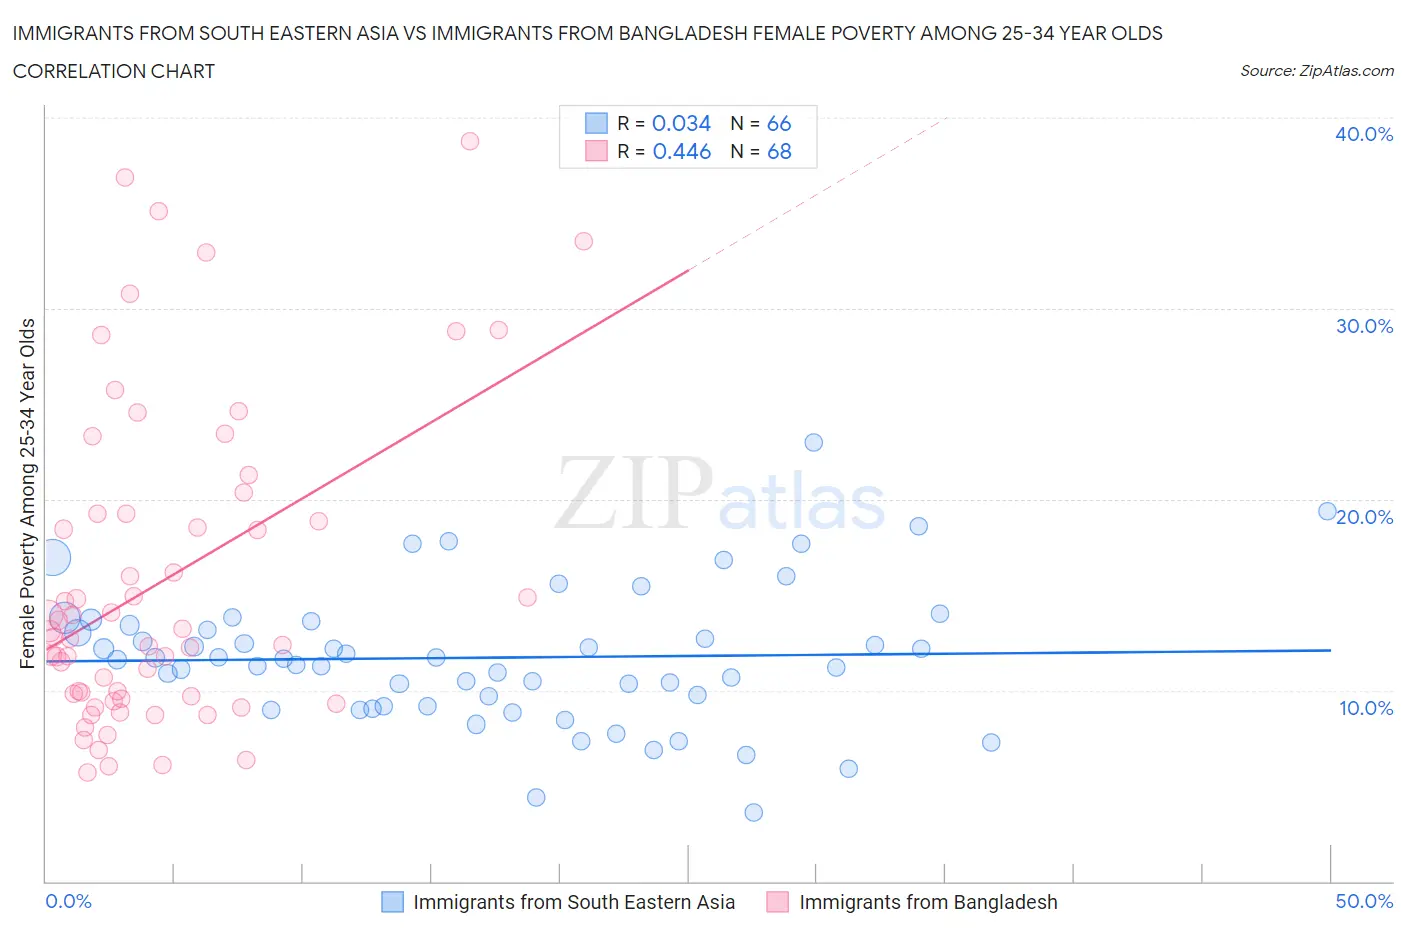
Immigrants from South Eastern Asia vs Immigrants from Bangladesh Female Poverty Among 25-34 Year Olds Correlation Chart
The statistical analysis conducted on geographies consisting of 499,745,803 people shows no correlation between the proportion of Immigrants from South Eastern Asia and poverty level among females between the ages 25 and 34 in the United States with a correlation coefficient (R) of 0.034 and weighted average of 12.5%. Similarly, the statistical analysis conducted on geographies consisting of 202,108,312 people shows a moderate positive correlation between the proportion of Immigrants from Bangladesh and poverty level among females between the ages 25 and 34 in the United States with a correlation coefficient (R) of 0.446 and weighted average of 14.8%, a difference of 18.4%.
Female Poverty Among 25-34 Year Olds Correlation Summary
| Measurement | Immigrants from South Eastern Asia | Immigrants from Bangladesh |
| Minimum | 3.6% | 5.7% |
| Maximum | 23.0% | 38.8% |
| Range | 19.4% | 33.0% |
| Mean | 11.7% | 15.8% |
| Median | 11.6% | 12.9% |
| Interquartile 25% (IQ1) | 9.2% | 9.6% |
| Interquartile 75% (IQ3) | 13.4% | 19.2% |
| Interquartile Range (IQR) | 4.2% | 9.6% |
| Standard Deviation (Sample) | 3.6% | 8.3% |
| Standard Deviation (Population) | 3.6% | 8.2% |
Similar Demographics by Female Poverty Among 25-34 Year Olds
Demographics Similar to Immigrants from South Eastern Asia by Female Poverty Among 25-34 Year Olds
In terms of female poverty among 25-34 year olds, the demographic groups most similar to Immigrants from South Eastern Asia are Croatian (12.5%, a difference of 0.010%), Argentinean (12.5%, a difference of 0.040%), Immigrants from Latvia (12.5%, a difference of 0.11%), Immigrants from Austria (12.5%, a difference of 0.11%), and Albanian (12.5%, a difference of 0.17%).
| Demographics | Rating | Rank | Female Poverty Among 25-34 Year Olds |
| Immigrants | Ukraine | 98.6 /100 | #78 | Exceptional 12.3% |
| Immigrants | Jordan | 98.5 /100 | #79 | Exceptional 12.4% |
| Immigrants | Malaysia | 98.3 /100 | #80 | Exceptional 12.4% |
| Immigrants | Kazakhstan | 98.1 /100 | #81 | Exceptional 12.4% |
| Ethiopians | 98.0 /100 | #82 | Exceptional 12.4% |
| Albanians | 97.7 /100 | #83 | Exceptional 12.5% |
| Immigrants | Latvia | 97.7 /100 | #84 | Exceptional 12.5% |
| Immigrants | South Eastern Asia | 97.6 /100 | #85 | Exceptional 12.5% |
| Croatians | 97.5 /100 | #86 | Exceptional 12.5% |
| Argentineans | 97.5 /100 | #87 | Exceptional 12.5% |
| Immigrants | Austria | 97.4 /100 | #88 | Exceptional 12.5% |
| Italians | 97.2 /100 | #89 | Exceptional 12.5% |
| Immigrants | Albania | 97.1 /100 | #90 | Exceptional 12.5% |
| Norwegians | 96.9 /100 | #91 | Exceptional 12.6% |
| Immigrants | Armenia | 96.9 /100 | #92 | Exceptional 12.6% |
Demographics Similar to Immigrants from Bangladesh by Female Poverty Among 25-34 Year Olds
In terms of female poverty among 25-34 year olds, the demographic groups most similar to Immigrants from Bangladesh are Immigrants from Nicaragua (14.8%, a difference of 0.010%), Scotch-Irish (14.8%, a difference of 0.040%), Barbadian (14.8%, a difference of 0.040%), Immigrants from Middle Africa (14.8%, a difference of 0.18%), and Jamaican (14.8%, a difference of 0.22%).
| Demographics | Rating | Rank | Female Poverty Among 25-34 Year Olds |
| Immigrants | Ghana | 1.4 /100 | #237 | Tragic 14.7% |
| Alsatians | 1.4 /100 | #238 | Tragic 14.7% |
| Malaysians | 1.4 /100 | #239 | Tragic 14.7% |
| Immigrants | Grenada | 1.3 /100 | #240 | Tragic 14.7% |
| Scotch-Irish | 1.2 /100 | #241 | Tragic 14.8% |
| Barbadians | 1.2 /100 | #242 | Tragic 14.8% |
| Immigrants | Nicaragua | 1.1 /100 | #243 | Tragic 14.8% |
| Immigrants | Bangladesh | 1.1 /100 | #244 | Tragic 14.8% |
| Immigrants | Middle Africa | 1.0 /100 | #245 | Tragic 14.8% |
| Jamaicans | 1.0 /100 | #246 | Tragic 14.8% |
| German Russians | 0.8 /100 | #247 | Tragic 14.9% |
| Immigrants | Western Africa | 0.8 /100 | #248 | Tragic 14.9% |
| Immigrants | Haiti | 0.5 /100 | #249 | Tragic 15.0% |
| Immigrants | El Salvador | 0.5 /100 | #250 | Tragic 15.0% |
| Haitians | 0.5 /100 | #251 | Tragic 15.0% |