Immigrants from South Eastern Asia vs Brazilian Kindergarten
COMPARE
Immigrants from South Eastern Asia
Brazilian
Kindergarten
Kindergarten Comparison
Immigrants from South Eastern Asia
Brazilians
97.1%
KINDERGARTEN
0.0/ 100
METRIC RATING
301st/ 347
METRIC RANK
97.9%
KINDERGARTEN
47.6/ 100
METRIC RATING
178th/ 347
METRIC RANK
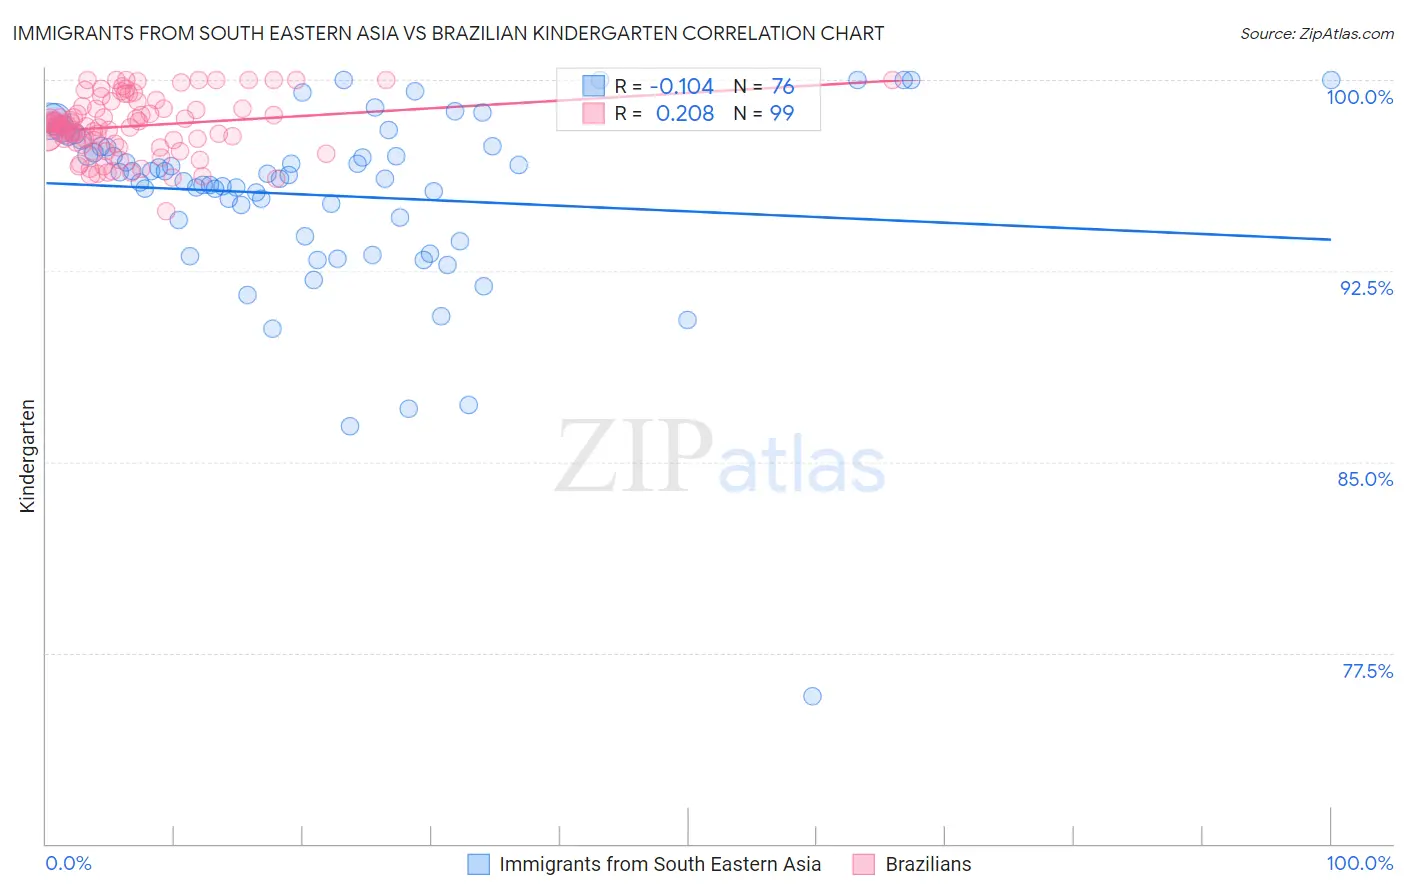
Immigrants from South Eastern Asia vs Brazilian Kindergarten Correlation Chart
The statistical analysis conducted on geographies consisting of 512,710,277 people shows a poor negative correlation between the proportion of Immigrants from South Eastern Asia and percentage of population with at least kindergarten education in the United States with a correlation coefficient (R) of -0.104 and weighted average of 97.1%. Similarly, the statistical analysis conducted on geographies consisting of 323,962,626 people shows a weak positive correlation between the proportion of Brazilians and percentage of population with at least kindergarten education in the United States with a correlation coefficient (R) of 0.208 and weighted average of 97.9%, a difference of 0.87%.
Kindergarten Correlation Summary
| Measurement | Immigrants from South Eastern Asia | Brazilian |
| Minimum | 75.8% | 94.8% |
| Maximum | 100.0% | 100.0% |
| Range | 24.2% | 5.2% |
| Mean | 95.5% | 98.2% |
| Median | 96.2% | 98.2% |
| Interquartile 25% (IQ1) | 94.2% | 97.5% |
| Interquartile 75% (IQ3) | 97.4% | 99.0% |
| Interquartile Range (IQR) | 3.2% | 1.5% |
| Standard Deviation (Sample) | 3.7% | 1.2% |
| Standard Deviation (Population) | 3.7% | 1.1% |
Similar Demographics by Kindergarten
Demographics Similar to Immigrants from South Eastern Asia by Kindergarten
In terms of kindergarten, the demographic groups most similar to Immigrants from South Eastern Asia are Haitian (97.1%, a difference of 0.020%), Immigrants from Cuba (97.1%, a difference of 0.030%), Immigrants from Caribbean (97.1%, a difference of 0.030%), Immigrants from Dominica (97.1%, a difference of 0.040%), and Central American Indian (97.2%, a difference of 0.050%).
| Demographics | Rating | Rank | Kindergarten |
| Immigrants | Immigrants | 0.0 /100 | #294 | Tragic 97.2% |
| Immigrants | Grenada | 0.0 /100 | #295 | Tragic 97.2% |
| Immigrants | Eritrea | 0.0 /100 | #296 | Tragic 97.2% |
| Central American Indians | 0.0 /100 | #297 | Tragic 97.2% |
| Immigrants | Dominica | 0.0 /100 | #298 | Tragic 97.1% |
| Immigrants | Cuba | 0.0 /100 | #299 | Tragic 97.1% |
| Haitians | 0.0 /100 | #300 | Tragic 97.1% |
| Immigrants | South Eastern Asia | 0.0 /100 | #301 | Tragic 97.1% |
| Immigrants | Caribbean | 0.0 /100 | #302 | Tragic 97.1% |
| Somalis | 0.0 /100 | #303 | Tragic 97.0% |
| Nicaraguans | 0.0 /100 | #304 | Tragic 97.0% |
| Ecuadorians | 0.0 /100 | #305 | Tragic 97.0% |
| Belizeans | 0.0 /100 | #306 | Tragic 97.0% |
| Hispanics or Latinos | 0.0 /100 | #307 | Tragic 97.0% |
| Immigrants | Somalia | 0.0 /100 | #308 | Tragic 97.0% |
Demographics Similar to Brazilians by Kindergarten
In terms of kindergarten, the demographic groups most similar to Brazilians are Albanian (97.9%, a difference of 0.0%), Immigrants from Venezuela (97.9%, a difference of 0.0%), Argentinean (97.9%, a difference of 0.0%), Immigrants from Bosnia and Herzegovina (97.9%, a difference of 0.0%), and Native/Alaskan (98.0%, a difference of 0.010%).
| Demographics | Rating | Rank | Kindergarten |
| Immigrants | Jordan | 54.0 /100 | #171 | Average 98.0% |
| Natives/Alaskans | 51.0 /100 | #172 | Average 98.0% |
| Kenyans | 51.0 /100 | #173 | Average 98.0% |
| Immigrants | Brazil | 50.0 /100 | #174 | Average 98.0% |
| Immigrants | Sri Lanka | 49.6 /100 | #175 | Average 97.9% |
| Albanians | 48.5 /100 | #176 | Average 97.9% |
| Immigrants | Venezuela | 47.9 /100 | #177 | Average 97.9% |
| Brazilians | 47.6 /100 | #178 | Average 97.9% |
| Argentineans | 46.8 /100 | #179 | Average 97.9% |
| Immigrants | Bosnia and Herzegovina | 46.7 /100 | #180 | Average 97.9% |
| Portuguese | 43.5 /100 | #181 | Average 97.9% |
| Egyptians | 42.4 /100 | #182 | Average 97.9% |
| Immigrants | Poland | 41.4 /100 | #183 | Average 97.9% |
| Immigrants | Argentina | 40.7 /100 | #184 | Average 97.9% |
| Immigrants | Belarus | 39.4 /100 | #185 | Fair 97.9% |