Choctaw vs Shoshone GED/Equivalency
COMPARE
Choctaw
Shoshone
GED/Equivalency
GED/Equivalency Comparison
Choctaw
Shoshone
83.1%
GED/EQUIVALENCY
0.3/ 100
METRIC RATING
260th/ 347
METRIC RANK
83.7%
GED/EQUIVALENCY
1.0/ 100
METRIC RATING
250th/ 347
METRIC RANK
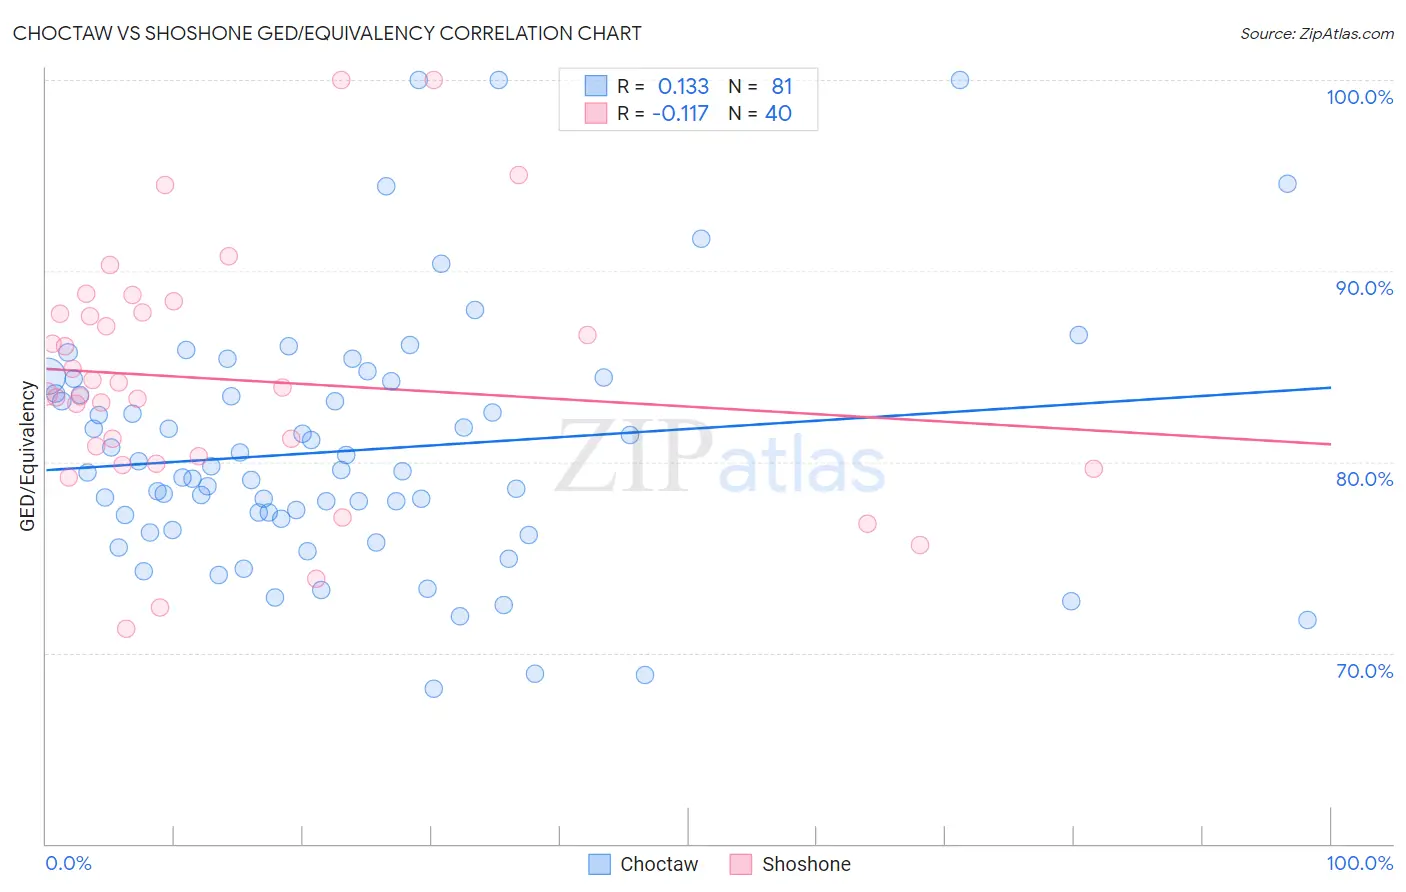
Choctaw vs Shoshone GED/Equivalency Correlation Chart
The statistical analysis conducted on geographies consisting of 269,738,650 people shows a poor positive correlation between the proportion of Choctaw and percentage of population with at least ged/equivalency education in the United States with a correlation coefficient (R) of 0.133 and weighted average of 83.1%. Similarly, the statistical analysis conducted on geographies consisting of 66,627,351 people shows a poor negative correlation between the proportion of Shoshone and percentage of population with at least ged/equivalency education in the United States with a correlation coefficient (R) of -0.117 and weighted average of 83.7%, a difference of 0.75%.
GED/Equivalency Correlation Summary
| Measurement | Choctaw | Shoshone |
| Minimum | 68.1% | 71.3% |
| Maximum | 100.0% | 100.0% |
| Range | 31.9% | 28.7% |
| Mean | 80.6% | 84.3% |
| Median | 79.5% | 83.7% |
| Interquartile 25% (IQ1) | 76.7% | 80.1% |
| Interquartile 75% (IQ3) | 83.9% | 87.8% |
| Interquartile Range (IQR) | 7.2% | 7.7% |
| Standard Deviation (Sample) | 6.5% | 6.5% |
| Standard Deviation (Population) | 6.5% | 6.4% |
Demographics Similar to Choctaw and Shoshone by GED/Equivalency
In terms of ged/equivalency, the demographic groups most similar to Choctaw are Immigrants from Vietnam (83.2%, a difference of 0.030%), Inupiat (83.1%, a difference of 0.050%), Immigrants from Armenia (83.1%, a difference of 0.060%), Immigrants from Congo (83.1%, a difference of 0.070%), and Bangladeshi (83.1%, a difference of 0.080%). Similarly, the demographic groups most similar to Shoshone are Blackfeet (83.8%, a difference of 0.020%), Crow (83.8%, a difference of 0.020%), Immigrants from Western Africa (83.8%, a difference of 0.040%), Chickasaw (83.8%, a difference of 0.070%), and Immigrants from Senegal (83.8%, a difference of 0.090%).
| Demographics | Rating | Rank | GED/Equivalency |
| Immigrants | Senegal | 1.2 /100 | #245 | Tragic 83.8% |
| Chickasaw | 1.2 /100 | #246 | Tragic 83.8% |
| Immigrants | Western Africa | 1.1 /100 | #247 | Tragic 83.8% |
| Blackfeet | 1.1 /100 | #248 | Tragic 83.8% |
| Crow | 1.1 /100 | #249 | Tragic 83.8% |
| Shoshone | 1.0 /100 | #250 | Tragic 83.7% |
| Spanish Americans | 0.8 /100 | #251 | Tragic 83.6% |
| Bahamians | 0.8 /100 | #252 | Tragic 83.6% |
| Comanche | 0.7 /100 | #253 | Tragic 83.6% |
| Creek | 0.7 /100 | #254 | Tragic 83.6% |
| Colville | 0.5 /100 | #255 | Tragic 83.4% |
| Africans | 0.5 /100 | #256 | Tragic 83.4% |
| Jamaicans | 0.4 /100 | #257 | Tragic 83.3% |
| Malaysians | 0.4 /100 | #258 | Tragic 83.3% |
| Immigrants | Vietnam | 0.3 /100 | #259 | Tragic 83.2% |
| Choctaw | 0.3 /100 | #260 | Tragic 83.1% |
| Inupiat | 0.2 /100 | #261 | Tragic 83.1% |
| Immigrants | Armenia | 0.2 /100 | #262 | Tragic 83.1% |
| Immigrants | Congo | 0.2 /100 | #263 | Tragic 83.1% |
| Bangladeshis | 0.2 /100 | #264 | Tragic 83.1% |
| West Indians | 0.2 /100 | #265 | Tragic 83.1% |