Immigrants from South America vs African Associate's Degree
COMPARE
Immigrants from South America
African
Associate's Degree
Associate's Degree Comparison
Immigrants from South America
Africans
46.7%
ASSOCIATE'S DEGREE
59.9/ 100
METRIC RATING
165th/ 347
METRIC RANK
41.1%
ASSOCIATE'S DEGREE
0.2/ 100
METRIC RATING
265th/ 347
METRIC RANK
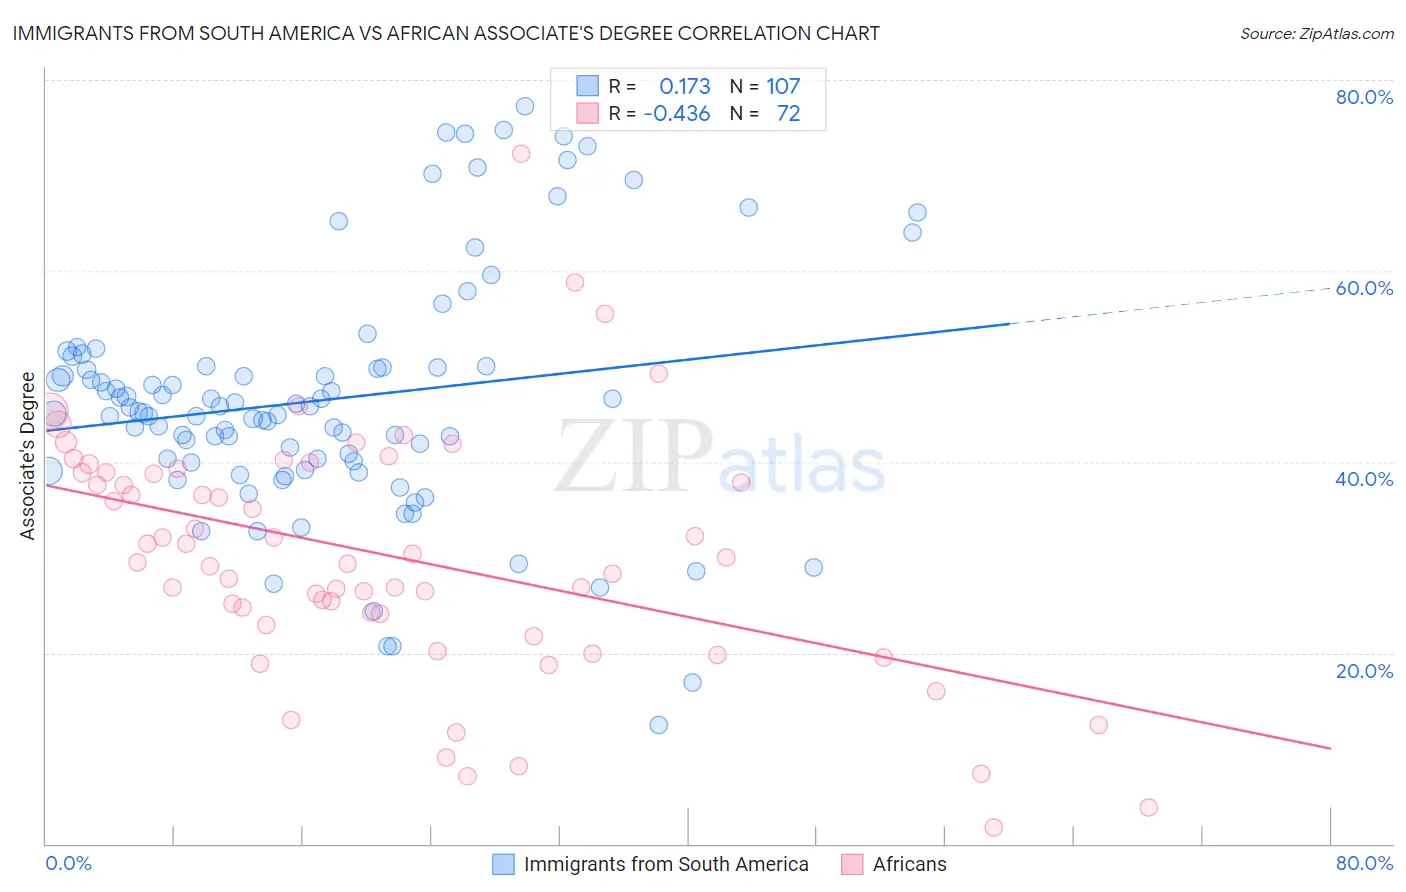
Immigrants from South America vs African Associate's Degree Correlation Chart
The statistical analysis conducted on geographies consisting of 486,384,317 people shows a poor positive correlation between the proportion of Immigrants from South America and percentage of population with at least associate's degree education in the United States with a correlation coefficient (R) of 0.173 and weighted average of 46.7%. Similarly, the statistical analysis conducted on geographies consisting of 470,057,267 people shows a moderate negative correlation between the proportion of Africans and percentage of population with at least associate's degree education in the United States with a correlation coefficient (R) of -0.436 and weighted average of 41.1%, a difference of 13.5%.
Associate's Degree Correlation Summary
| Measurement | Immigrants from South America | African |
| Minimum | 12.4% | 1.7% |
| Maximum | 77.3% | 72.2% |
| Range | 64.9% | 70.5% |
| Mean | 46.5% | 30.2% |
| Median | 45.2% | 29.7% |
| Interquartile 25% (IQ1) | 40.0% | 23.5% |
| Interquartile 75% (IQ3) | 50.0% | 38.9% |
| Interquartile Range (IQR) | 10.0% | 15.4% |
| Standard Deviation (Sample) | 12.9% | 12.9% |
| Standard Deviation (Population) | 12.8% | 12.8% |
Similar Demographics by Associate's Degree
Demographics Similar to Immigrants from South America by Associate's Degree
In terms of associate's degree, the demographic groups most similar to Immigrants from South America are Hungarian (46.7%, a difference of 0.040%), Immigrants from Sierra Leone (46.7%, a difference of 0.050%), Colombian (46.8%, a difference of 0.20%), Somali (46.8%, a difference of 0.21%), and Immigrants from Africa (46.8%, a difference of 0.26%).
| Demographics | Rating | Rank | Associate's Degree |
| Immigrants | Germany | 69.7 /100 | #158 | Good 47.1% |
| Immigrants | Poland | 69.2 /100 | #159 | Good 47.1% |
| Scottish | 65.4 /100 | #160 | Good 46.9% |
| Scandinavians | 65.2 /100 | #161 | Good 46.9% |
| Immigrants | Africa | 63.2 /100 | #162 | Good 46.8% |
| Somalis | 62.5 /100 | #163 | Good 46.8% |
| Colombians | 62.4 /100 | #164 | Good 46.8% |
| Immigrants | South America | 59.9 /100 | #165 | Average 46.7% |
| Hungarians | 59.3 /100 | #166 | Average 46.7% |
| Immigrants | Sierra Leone | 59.2 /100 | #167 | Average 46.7% |
| Immigrants | Somalia | 55.5 /100 | #168 | Average 46.5% |
| Uruguayans | 55.4 /100 | #169 | Average 46.5% |
| Irish | 53.6 /100 | #170 | Average 46.5% |
| Basques | 52.8 /100 | #171 | Average 46.5% |
| Peruvians | 50.5 /100 | #172 | Average 46.4% |
Demographics Similar to Africans by Associate's Degree
In terms of associate's degree, the demographic groups most similar to Africans are Samoan (41.1%, a difference of 0.0%), Hawaiian (40.9%, a difference of 0.56%), Osage (41.5%, a difference of 0.76%), Central American Indian (40.8%, a difference of 0.76%), and Immigrants from Jamaica (41.5%, a difference of 0.77%).
| Demographics | Rating | Rank | Associate's Degree |
| Japanese | 0.5 /100 | #258 | Tragic 41.7% |
| Malaysians | 0.4 /100 | #259 | Tragic 41.6% |
| Marshallese | 0.4 /100 | #260 | Tragic 41.6% |
| Nicaraguans | 0.4 /100 | #261 | Tragic 41.5% |
| Bahamians | 0.4 /100 | #262 | Tragic 41.5% |
| Immigrants | Jamaica | 0.3 /100 | #263 | Tragic 41.5% |
| Osage | 0.3 /100 | #264 | Tragic 41.5% |
| Africans | 0.2 /100 | #265 | Tragic 41.1% |
| Samoans | 0.2 /100 | #266 | Tragic 41.1% |
| Hawaiians | 0.2 /100 | #267 | Tragic 40.9% |
| Central American Indians | 0.2 /100 | #268 | Tragic 40.8% |
| Americans | 0.2 /100 | #269 | Tragic 40.8% |
| Chippewa | 0.2 /100 | #270 | Tragic 40.7% |
| Immigrants | Laos | 0.1 /100 | #271 | Tragic 40.7% |
| Belizeans | 0.1 /100 | #272 | Tragic 40.6% |