Immigrants from South America vs Immigrants from Croatia Associate's Degree
COMPARE
Immigrants from South America
Immigrants from Croatia
Associate's Degree
Associate's Degree Comparison
Immigrants from South America
Immigrants from Croatia
46.7%
ASSOCIATE'S DEGREE
59.9/ 100
METRIC RATING
165th/ 347
METRIC RANK
50.2%
ASSOCIATE'S DEGREE
98.9/ 100
METRIC RATING
86th/ 347
METRIC RANK
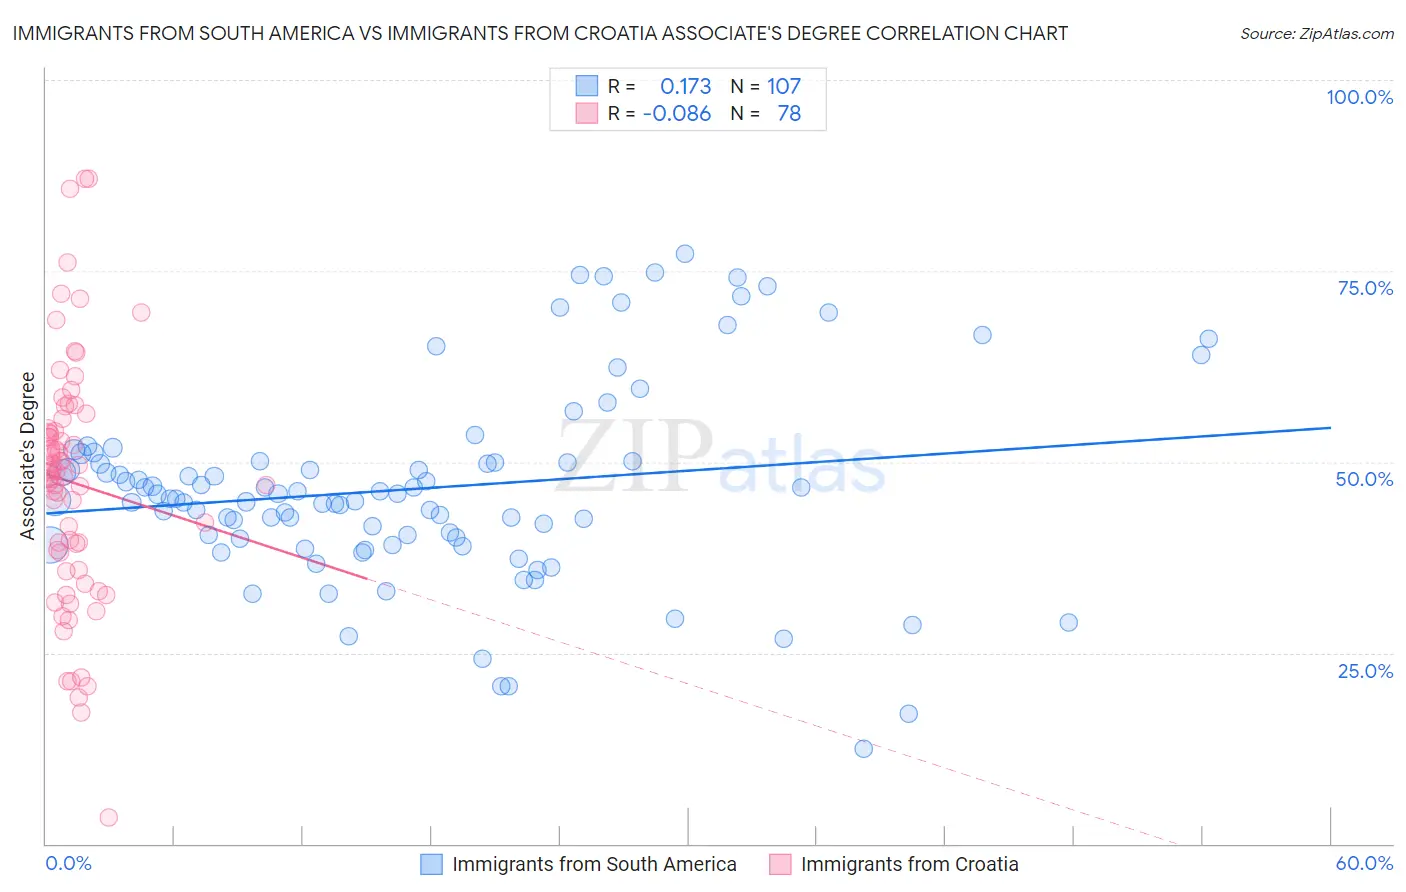
Immigrants from South America vs Immigrants from Croatia Associate's Degree Correlation Chart
The statistical analysis conducted on geographies consisting of 486,384,317 people shows a poor positive correlation between the proportion of Immigrants from South America and percentage of population with at least associate's degree education in the United States with a correlation coefficient (R) of 0.173 and weighted average of 46.7%. Similarly, the statistical analysis conducted on geographies consisting of 132,578,161 people shows a slight negative correlation between the proportion of Immigrants from Croatia and percentage of population with at least associate's degree education in the United States with a correlation coefficient (R) of -0.086 and weighted average of 50.2%, a difference of 7.5%.
Associate's Degree Correlation Summary
| Measurement | Immigrants from South America | Immigrants from Croatia |
| Minimum | 12.4% | 3.4% |
| Maximum | 77.3% | 87.1% |
| Range | 64.9% | 83.7% |
| Mean | 46.5% | 47.3% |
| Median | 45.2% | 48.7% |
| Interquartile 25% (IQ1) | 40.0% | 38.1% |
| Interquartile 75% (IQ3) | 50.0% | 54.3% |
| Interquartile Range (IQR) | 10.0% | 16.2% |
| Standard Deviation (Sample) | 12.9% | 15.9% |
| Standard Deviation (Population) | 12.8% | 15.8% |
Similar Demographics by Associate's Degree
Demographics Similar to Immigrants from South America by Associate's Degree
In terms of associate's degree, the demographic groups most similar to Immigrants from South America are Hungarian (46.7%, a difference of 0.040%), Immigrants from Sierra Leone (46.7%, a difference of 0.050%), Colombian (46.8%, a difference of 0.20%), Somali (46.8%, a difference of 0.21%), and Immigrants from Africa (46.8%, a difference of 0.26%).
| Demographics | Rating | Rank | Associate's Degree |
| Immigrants | Germany | 69.7 /100 | #158 | Good 47.1% |
| Immigrants | Poland | 69.2 /100 | #159 | Good 47.1% |
| Scottish | 65.4 /100 | #160 | Good 46.9% |
| Scandinavians | 65.2 /100 | #161 | Good 46.9% |
| Immigrants | Africa | 63.2 /100 | #162 | Good 46.8% |
| Somalis | 62.5 /100 | #163 | Good 46.8% |
| Colombians | 62.4 /100 | #164 | Good 46.8% |
| Immigrants | South America | 59.9 /100 | #165 | Average 46.7% |
| Hungarians | 59.3 /100 | #166 | Average 46.7% |
| Immigrants | Sierra Leone | 59.2 /100 | #167 | Average 46.7% |
| Immigrants | Somalia | 55.5 /100 | #168 | Average 46.5% |
| Uruguayans | 55.4 /100 | #169 | Average 46.5% |
| Irish | 53.6 /100 | #170 | Average 46.5% |
| Basques | 52.8 /100 | #171 | Average 46.5% |
| Peruvians | 50.5 /100 | #172 | Average 46.4% |
Demographics Similar to Immigrants from Croatia by Associate's Degree
In terms of associate's degree, the demographic groups most similar to Immigrants from Croatia are Immigrants from Egypt (50.2%, a difference of 0.010%), Immigrants from Hungary (50.2%, a difference of 0.060%), Immigrants from Uzbekistan (50.3%, a difference of 0.080%), Greek (50.3%, a difference of 0.12%), and Immigrants from Moldova (50.2%, a difference of 0.12%).
| Demographics | Rating | Rank | Associate's Degree |
| Ethiopians | 99.1 /100 | #79 | Exceptional 50.4% |
| Armenians | 99.1 /100 | #80 | Exceptional 50.4% |
| Maltese | 99.1 /100 | #81 | Exceptional 50.4% |
| Greeks | 98.9 /100 | #82 | Exceptional 50.3% |
| Immigrants | Uzbekistan | 98.9 /100 | #83 | Exceptional 50.3% |
| Immigrants | Hungary | 98.9 /100 | #84 | Exceptional 50.2% |
| Immigrants | Egypt | 98.9 /100 | #85 | Exceptional 50.2% |
| Immigrants | Croatia | 98.9 /100 | #86 | Exceptional 50.2% |
| Immigrants | Moldova | 98.8 /100 | #87 | Exceptional 50.2% |
| Immigrants | Canada | 98.7 /100 | #88 | Exceptional 50.1% |
| Immigrants | Western Europe | 98.7 /100 | #89 | Exceptional 50.1% |
| Immigrants | Ethiopia | 98.7 /100 | #90 | Exceptional 50.1% |
| Immigrants | Western Asia | 98.7 /100 | #91 | Exceptional 50.1% |
| Immigrants | North America | 98.7 /100 | #92 | Exceptional 50.1% |
| Immigrants | Brazil | 98.5 /100 | #93 | Exceptional 50.0% |